Select the correct answer.
The histogram shows the number of hours the students in Mr. Quentin...

Mathematics, 06.04.2020 03:30 Terrydactly
Select the correct answer.
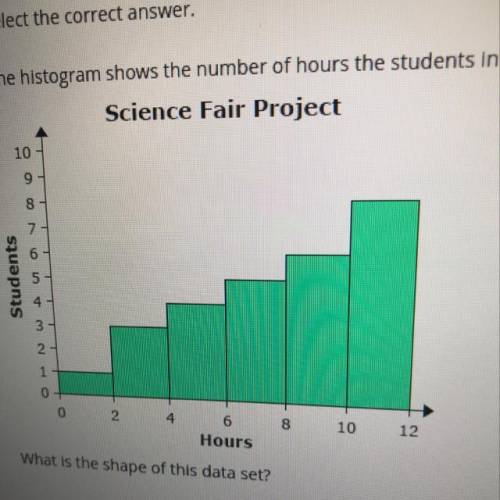
The histogram shows the number of hours the students in Mr. Quentin's class spent doing online research for a science fair project.
Science Fair Project
Students
Hours
What is the shape of this data set?
A
cannot be determined
B.
skewed left
dmentum. All rights reserved.

Answers: 1


Another question on Mathematics
Mathematics, 21.06.2019 18:00
Assume that the weights of quarters are normally distributed with a mean of 5.67 g and a standard deviation 0.070 g. a vending machine will only accept coins weighing between 5.48 g and 5.82 g. what percentage of legal quarters will be rejected? round your answer to two decimal places.
Answers: 1
Mathematics, 21.06.2019 18:40
Offering 30 if a plus b plus c equals 68 and ab plus bc plus ca equals 1121, where a, b, and c are all prime numbers, find the value of abc. the answer is 1978 but i need an explanation on how to get that.
Answers: 3
Mathematics, 21.06.2019 22:30
There were 25 students who answered to a survey about sports. four-fifths of them like football. how many students like football?
Answers: 2
You know the right answer?
Questions
Mathematics, 08.01.2021 19:10

Geography, 08.01.2021 19:10

Social Studies, 08.01.2021 19:10

Health, 08.01.2021 19:10

Mathematics, 08.01.2021 19:10
English, 08.01.2021 19:10

Mathematics, 08.01.2021 19:10
Mathematics, 08.01.2021 19:10
English, 08.01.2021 19:10

Mathematics, 08.01.2021 19:10


