Use the information below to sketch a graph of the polynomial
function y = f(x).
• f(x)...

Mathematics, 06.04.2020 04:51 AdoNice
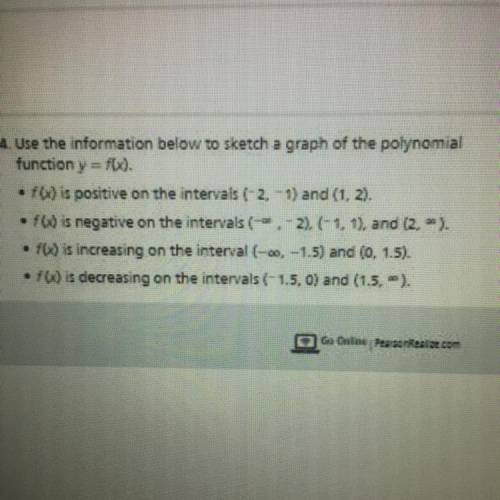
Use the information below to sketch a graph of the polynomial
function y = f(x).
• f(x) is positive on the intervals (-2, -1) and (1, 2).
• F(x) is negative on the intervals (-- .-2), (-1, 1), and (2. ”).
• f(x) is increasing on the interval (-0, -1.5) and (o. 1,5).
• F(x) is decreasing on the intervals (-1.5.0) and (1.5. ~).

Answers: 1


Another question on Mathematics
Mathematics, 21.06.2019 19:30
Atemperature of 1.64◦f corresponds to answer in units of ◦c.
Answers: 1
Mathematics, 21.06.2019 21:30
Which equation is true? i. 56 ÷ 4·7 = 82 ÷ (11 + 5) ii. (24 ÷ 8 + 2)3 = (42 + 9)2 neither i nor ii ii only i and ii i only
Answers: 1
Mathematics, 21.06.2019 21:30
Find the unit rate for: 75% high-fiber chimp food to 25% high -protein chimp food.
Answers: 2
Mathematics, 21.06.2019 21:50
Aline passes through the point (–7, 5) and has a slope of 1/2 which is another point that the line passes through?
Answers: 3
You know the right answer?
Questions


Mathematics, 26.10.2020 16:40
Mathematics, 26.10.2020 16:40

Health, 26.10.2020 16:40

Mathematics, 26.10.2020 16:40


