
Mathematics, 06.04.2020 18:26 josecano2
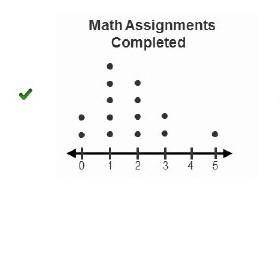
Ira described the data on a dot plot as having a cluster from 0 to 3, a gap at 4, a peak at 1, and being skewed right. Which dot plot shows the data Ira is describing?

Answers: 1


Another question on Mathematics
Mathematics, 21.06.2019 19:30
Choose the more precise measurement. 26.4 cm or 8.39 cm
Answers: 1
Mathematics, 22.06.2019 01:00
You have just applied, and have been approved for a $58,000 mortgage. the rate quoted to you by the lender is 6.1% for a 30 year fixed mortgage. determine how much of your third month’s payment goes towards the principal. $56.65 $56.93 $57.22 $57.51
Answers: 2
Mathematics, 22.06.2019 01:30
In a sale there is 25% of all prices a chair costs £45 in sale how much was it before the sale
Answers: 1
Mathematics, 22.06.2019 01:30
Add: (6x^2-5x+3) + (3x^3+7x-8) a. 9x^2+12x-5 b. 9x^2+2x+11 c. 9x^2+2x-5 d. 9x^2-2x+5
Answers: 1
You know the right answer?
Ira described the data on a dot plot as having a cluster from 0 to 3, a gap at 4, a peak at 1, and b...
Questions
Mathematics, 09.09.2019 22:30


Law, 09.09.2019 22:30
English, 09.09.2019 22:30

English, 09.09.2019 22:30


