
Mathematics, 06.04.2020 23:10 cristinavalencia03
Every few years, the National Assessment of Educational Progress asks a national sample of eighth-graders to perform the same math tasks. The goal is to get an honest picture of progress in math. Suppose these are the last few national mean scores, on a scale of 0 to 500.
Year 1990 1992 1996 2000 2003 2005 2008
Score 263 268 271 272 276 277 279
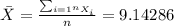
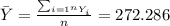
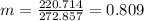
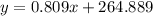
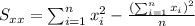
(a) Find the regression line of mean score on time step-by-step. First calculate the mean and standard deviation of each variable and their correlation (use a calculator with these functions). Then find the equation of the least-squares line from these
(b) What percent of the year-to-year variation in scores is explained by the linear trend?

Answers: 1

![r=\frac{n(\sum xy)-(\sum x)(\sum y)}{\sqrt{[n\sum x^2 -(\sum x)^2][n\sum y^2 -(\sum y)^2]}}](/tpl/images/0585/0730/ec454.png)
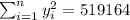
![r=\frac{7(17647)-(64)(1906)}{\sqrt{[7(858) -(64)^2][7(519164) -(1906)^2]}}=0.97599](/tpl/images/0585/0730/738ef.png)


 and we got:


Another question on Mathematics
Mathematics, 20.06.2019 18:04
Aquadratic function f(x) has a turning point at (3,-7). what is the turning point of -f(x)?
Answers: 1
Mathematics, 21.06.2019 19:00
John used linear combination to solve the system of equations shown. he did so by multiplying the first equation by -3 and the second equation by another number to eliminate the x-terms. what number did jonas multiply the second equation by? 4x-6y=23x+5y=11
Answers: 2
Mathematics, 21.06.2019 20:40
Reduce fractions expressing probability to lowest terms. in 3,000 repetitions of an experiment, a random event occurred in 500 cases. the expected probability of this event is?
Answers: 3
You know the right answer?
Every few years, the National Assessment of Educational Progress asks a national sample of eighth-gr...
Questions
Mathematics, 15.10.2019 08:50
Mathematics, 15.10.2019 08:50


History, 15.10.2019 08:50

Arts, 15.10.2019 08:50
History, 15.10.2019 08:50

English, 15.10.2019 08:50
Chemistry, 15.10.2019 08:50

Computers and Technology, 15.10.2019 08:50
Biology, 15.10.2019 08:50


Social Studies, 15.10.2019 08:50
Mathematics, 15.10.2019 08:50


