
Mathematics, 07.04.2020 02:14 haha396
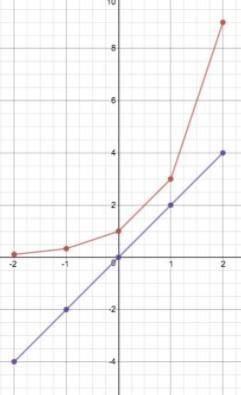
A. Plot the data for the functions ƒ(x) and g(x) on a grid. x -2 -1 0 1 2 ƒ(x) 1 4 16 x -1 0 1 2 3 g(x) 3 4 5 6 7 b. Identify each function as linear, quadratic, or exponential, and use complete sentences to explain your choices. c. Describe what happens to the function values in each function as x increases from left to right. d. At what value(s) of x are the function values equal? If you cannot give exact values for x, give estimates.

Answers: 2


Another question on Mathematics
Mathematics, 21.06.2019 22:00
Given the quadratic function f(x)=3x^2-24x+49 a. use “completing the squares” to convert the quadratic function into vertex form b. state the vertex c. find the x and y intercepts d. graph the function
Answers: 1
Mathematics, 22.06.2019 01:30
Which equation represents a line that passes through the point (9, -4) and has a slope of 3/5?
Answers: 1
Mathematics, 22.06.2019 04:20
Grace is a 70-year old woman who paid the utility bill online for the first time. she called her bank's customer service center to make sure she had done the transaction successfully. but the voice recording repeatedly played a message that all representatives were busy, which irked grace. which factor would make grace not recommend the bank to others? a. absence of technology b. lack of accessibility c. lack of financial products d. poor reputation
Answers: 1
Mathematics, 22.06.2019 04:40
The accompanying normal probability plot was constructed from a sample of 30 readings on tension for mesh screens behind the surface of video display tubes used in computer monitors. does it appear plausible that the tension distribution is normal? the given probability is has a significant downward curve, so it is plausible that the tension distribution is normal. the given probability is has a significant downward curve, so it is not plausible that the tension distribution is normal. the given probability is quite linear, so it is plausible that the tension distribution is normal. the given probability is has a significant upward curve, so it is not plausible that the tension distribution is normal. the given probability is quite linear, so it is not plausible that the tension distribution is normal.
Answers: 1
You know the right answer?
A. Plot the data for the functions ƒ(x) and g(x) on a grid. x -2 -1 0 1 2 ƒ(x) 1 4 16 x -1 0 1 2 3 g...
Questions

Mathematics, 01.12.2020 01:20

History, 01.12.2020 01:20
Mathematics, 01.12.2020 01:20


Mathematics, 01.12.2020 01:20

Computers and Technology, 01.12.2020 01:20
Mathematics, 01.12.2020 01:20


History, 01.12.2020 01:20


