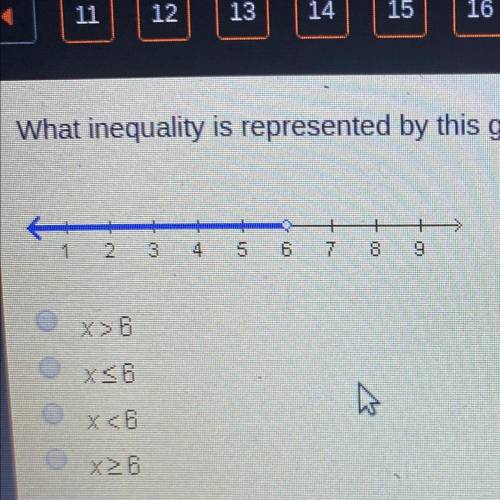
What inequality is represented by this graph. A. X>6 b. x<_6 c. X<6 D. X>_6
...

Mathematics, 07.04.2020 02:48 andrejr0330jr
What inequality is represented by this graph. A. X>6 b. x<_6 c. X<6 D. X>_6

Answers: 2


Another question on Mathematics
Mathematics, 21.06.2019 15:30
Find the perimeter of the figure shown above. a. 50 cm c. 30 cm b. 64 cm d. 60 cm select the best answer from the choices provided a b c d
Answers: 1
Mathematics, 21.06.2019 15:30
The function ƒ is defined by ƒ(x) = (x + 3)(x + 1). the graph of ƒ in the xy-plane is a parabola. which interval contains the x-coordinate of the vertex of the graph of ƒ?
Answers: 2
Mathematics, 21.06.2019 18:30
Which of the choices shown could be used to prove that aacp=abcp ?
Answers: 1
Mathematics, 22.06.2019 02:50
The graph of f(x) shown below has the same shape as the graph of g(x)=x^3-x^2 but it is shifted to the left 2 units what is its equation
Answers: 2
You know the right answer?
Questions
Mathematics, 18.11.2020 06:50

English, 18.11.2020 06:50
Mathematics, 18.11.2020 06:50

Chemistry, 18.11.2020 06:50
Mathematics, 18.11.2020 06:50

Biology, 18.11.2020 06:50
Mathematics, 18.11.2020 06:50

History, 18.11.2020 06:50


