
Mathematics, 07.04.2020 19:09 yoooo9313
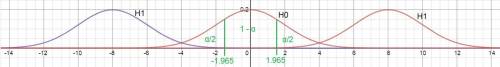
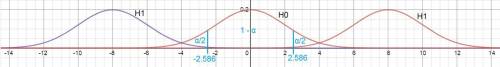
The alpha level that a researcher sets at the beginning of the experiment is the level to which he wishes to limit the probability of making the error of . Use the following Distributions tool to identify the boundaries that separate the extreme samples from the samples that are more obviously consistent with the null hypothesis. Assume the null hypothesis is nondirectional, meaning that the critical region is split across both tails of the distribution. The z-score boundaries at an alpha level α = .05 are: z = 1.96 and z = –1.96 z = 2.58 and z = –2.58 z = 3.29 and z = –3.29 To use the tool to identify the z-score boundaries, click on the icon with two orange lines, and slide the orange lines until the area in the critical region equals the alpha level. Remember that the probability will need to be split between the two tails. To use the tool to help you evaluate the hypothesis, click on the icon with the purple line, place the two orange lines on the critical values, and then place the purple line on the z statistic. The critical region is . The z-score boundaries for an alpha level α = 0.01 are: z = 3.29 and z = –3.29 z = 1.96 and z = –1.96 z = 2.58 and z = –2.58 Suppose that the calculated z statistic for a particular hypothesis test is 2.00 and the alpha is 0.01. This z statistic is the critical region. Therefore, the researcher reject the null hypothesis, and he conclude the alternative hypothesis is probably correct.

Answers: 3


Another question on Mathematics
Mathematics, 21.06.2019 16:40
Ajar contains a mixture of 20 black marbles, 16 red marbles, and 4 white marbles, all the same size. find the probability of drawing a white or red marble on the first draw. 125 12 01 next question ask for turn it in
Answers: 2
Mathematics, 21.06.2019 19:00
D(5, 7). e(4,3), and f(8, 2) form the vertices of a triangle. what is mzdef? oa. 30° ob. 45° oc. 60° od 90°
Answers: 1
Mathematics, 21.06.2019 19:20
The fraction of defective integrated circuits produced in a photolithography process is being studied. a random sample of 300 circuits is tested, revealing 17 defectives. (a) calculate a 95% two-sided confidence interval on the fraction of defective circuits produced by this particular tool. round the answers to 4 decimal places. less-than-or-equal-to p less-than-or-equal-to (b) calculate a 95% upper confidence bound on the fraction of defective circuits. round the answer to 4 decimal places. p less-than-or-equal-to
Answers: 3
Mathematics, 21.06.2019 20:00
Donald has x twenty-dollar bills and 11 ten-dollar bill. how much money does donald have? write your answer as an expression.
Answers: 2
You know the right answer?
The alpha level that a researcher sets at the beginning of the experiment is the level to which he w...
Questions

English, 20.09.2021 05:30

Physics, 20.09.2021 05:30
English, 20.09.2021 05:30

Arts, 20.09.2021 05:30
English, 20.09.2021 05:30


Health, 20.09.2021 05:30
Chemistry, 20.09.2021 05:30
Mathematics, 20.09.2021 05:30

Social Studies, 20.09.2021 05:30
English, 20.09.2021 05:30
English, 20.09.2021 05:30

World Languages, 20.09.2021 05:30

History, 20.09.2021 05:30


