
Mathematics, 09.04.2020 02:23 MysteryDove12
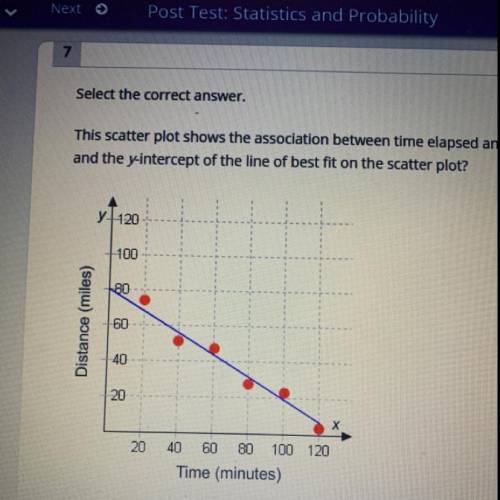
This scatter plot shows the association between time elapsed and distance left to go when John drove from City A to City B. What are the slope and the y-intercept of the line of best fit on the scatter plot?
A. The y-intercept is 80, and the slope is
B. The y-intercept is 80, and the slope is
C.
The y-intercept is 0, and the slo
D.
The y-intercept is 15, and the s
E.
The y-intercept is 0, and the slo

Answers: 1


Another question on Mathematics
Mathematics, 21.06.2019 17:00
The tuition costs, c, for a local community college are modeled by c(h) = 250 + 200h, where h represents the number of credit hours taken. the local state university has tuition costs, s, modeled by the function s(h) = 300 + 180h. how many credit hours will a student have to take for the two tuition costs to be equal? round the answer to the nearest tenth of an hour.
Answers: 3
Mathematics, 21.06.2019 18:40
The ratios 3: 9, 4: 12, 5: 15, and 6: 18 are a pattern of equivalent ratios in the ratio table. which is another ratio in this pattern?
Answers: 1
Mathematics, 21.06.2019 19:40
Given the sequence 7, 14, 28, 56, which expression shown would give the tenth term? a. 7^10 b. 7·2^10 c. 7·2^9
Answers: 1
You know the right answer?
This scatter plot shows the association between time elapsed and distance left to go when John drove...
Questions


History, 11.12.2020 01:00


Mathematics, 11.12.2020 01:00
Mathematics, 11.12.2020 01:00

Biology, 11.12.2020 01:00
Mathematics, 11.12.2020 01:00
Mathematics, 11.12.2020 01:00
Mathematics, 11.12.2020 01:00

Advanced Placement (AP), 11.12.2020 01:00
English, 11.12.2020 01:00

Mathematics, 11.12.2020 01:00


