
Mathematics, 15.04.2020 01:19 lexipiper8296
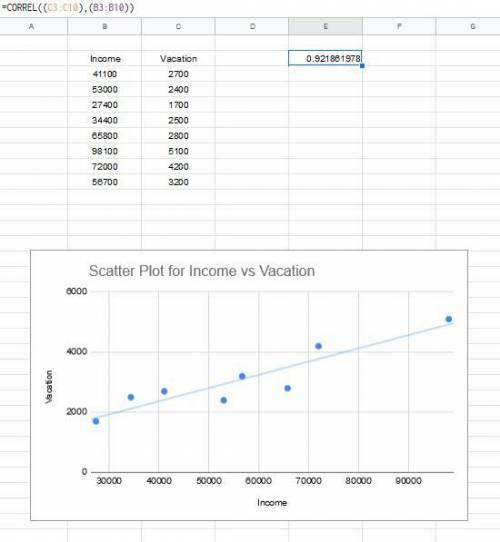
The following table shows the annual income, in dollars, and amount spent on vacation, in dollars, for a sample of 8 families.
Income 41,100 53,000 27,400 34,400 65,800 98,100 72,000 56,700
Vacation 2,700 2,400 1,700 2,500 2,800 5,100 4,200 3,200
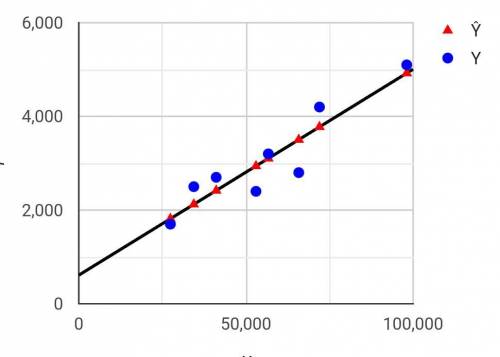
(a) Create a scatterplot of the data in the table.
(b) Describe the association shown in the scatterplot created in part (a).
(c) Calculate the coefficient of determination for the data, and interpret the value in context.

Answers: 3
![r=\frac{n(\sum xy)-(\sum x)(\sum y)}{\sqrt{[n\sum x^2-(\sum x)^2][n\sum y^2-(\sum y)^2}}\\\\\\\sum xy=153914\\\sum x=4485\\\sum y=246\\\sum x^2=2878447\\(\sum x)^2=4485^2=20115225\\(\sum y)^2=246^2=60516\\\sum y^2=8392\\n=8\\\\\#substitute \ and \ solve \ for \ r\\\\=\frac{8\times153914-4485\times 246}{\sqrt{[8\times 2878447-4485^2][8\times 8392-246^2]}}\\\\=0.92186\\\\\approx 0.9219](/tpl/images/0600/5176/3852f.png)


Another question on Mathematics
Mathematics, 21.06.2019 22:30
Factor the polynomial, if possible. if the polynomial cannot be factored, write prime. 9n^3 + 27n^2 – 25n – 75
Answers: 2
Mathematics, 21.06.2019 23:00
Siri can type 90 words in 40 minutes about how many words would you expect her to type in 10 minutes at this rate
Answers: 1
Mathematics, 21.06.2019 23:30
Kerion has a beaded necklace business. she can make 12 necklaces is 2 hours. how long will it take her to make 9 necklaces?
Answers: 1
You know the right answer?
The following table shows the annual income, in dollars, and amount spent on vacation, in dollars, f...
Questions


Social Studies, 09.04.2021 20:10

Mathematics, 09.04.2021 20:10
English, 09.04.2021 20:10


Chemistry, 09.04.2021 20:10
Mathematics, 09.04.2021 20:10
Mathematics, 09.04.2021 20:10
Mathematics, 09.04.2021 20:10

World Languages, 09.04.2021 20:10
Mathematics, 09.04.2021 20:10
Mathematics, 09.04.2021 20:10


