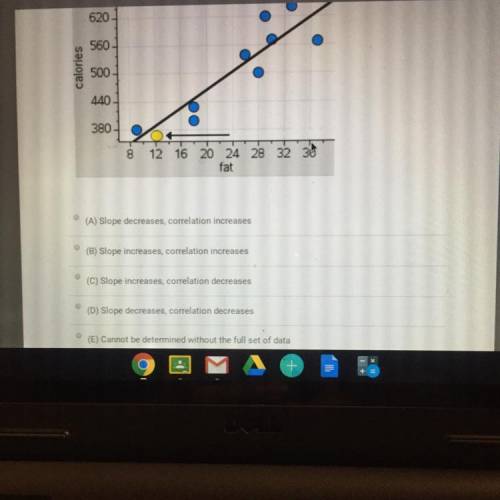
6. The scatterplot below shows data for the nine french fry orders from the
previous problem....

Mathematics, 15.04.2020 04:16 jisalinas5576
6. The scatterplot below shows data for the nine french fry orders from the
previous problem. A tenth fast food chain has been added, as indicated by the
arrow. How would this tenth data point affect the slope and correlation in this scenario?


Answers: 3


Another question on Mathematics

Mathematics, 21.06.2019 17:10
The graph of g(x) is a translation of y = which equation represents g(x)?
Answers: 1

Mathematics, 21.06.2019 20:30
Answer for 10 points show work you guys in advanced < 3
Answers: 1

Mathematics, 22.06.2019 01:50
The length of time it takes to find a parking space at 9 a.m. follows a normal distribution with a mean of 5 minutes and a standard deviation of 2 minutes. find the probability that it takes at least 8 minutes to find a parking space. (round your answer to four decimal places.)
Answers: 1

Mathematics, 22.06.2019 04:10
Which expression is equivalent to the square root of 2 multipllied by 5 divided by 18
Answers: 2
You know the right answer?
Questions


Biology, 12.08.2021 23:00

Mathematics, 12.08.2021 23:00


Engineering, 12.08.2021 23:00

Mathematics, 12.08.2021 23:00


History, 12.08.2021 23:10


History, 12.08.2021 23:10


