(this question is for image number 2)
1.The following dot plot represents a random sampl...

Mathematics, 15.04.2020 17:26 darrengresham999
(this question is for image number 2)
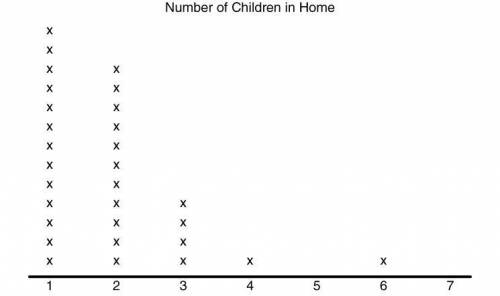
1.The following dot plot represents a random sample of elementary students and the number of children that live in their home.
Part 1: What is the range of the data set?
Part 2: What is the interquartile range of the data set?
Part 3: What is the mean absolute deviation of the data set? [Round both the mean and the mean absolute deviation to the nearest tenth.]
2.The following dot plot represents a random sample of elementary students and the number of children that live in their home.
Calculate the measures of central tendency for this set of data. Which of the following statements is NOT true?
a. The mean is closer in value to the mode than to the median.
b. The median is the largest measure of central tendency.
c. The median is greater than the mode.
d. The mode is less than the mean.
(questions for image 1)
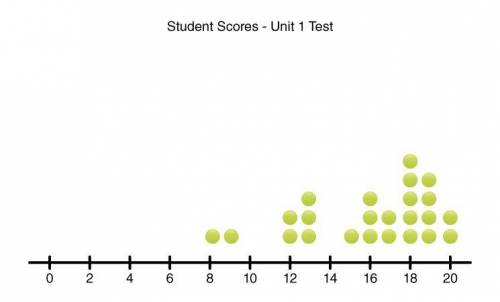
1.The following dot plot represents student scores on the Unit 1 math test. Scores are in whole number increments. If the test was out of 20 points, about what percentage of the students scored at least 80% on the test?
a.48%
b.67%
c.17%
d.12%
2.The following dot plot represents student scores on the Unit 1 math test. Scores are in whole number increments.
Part 1: What is the mean score, rounded to the nearest whole number?
Part 2: What is the median score?
Part 3: What is the mode score?
3.The following dot plot represents student scores on the Unit 1 math test. Scores are in whole number increments.
For this data set, the value of the range is about(CHOOSE: the same as or triple, or twice) the value of the interquartile range.
On average, the data points lie between(CHOOSE: 3 and 4 or 5 and 6 or 1 and 2 or 2 and 3 or 4 and 5) points from the mean.
HELP MEH ASAP

Answers: 1


Another question on Mathematics
Mathematics, 21.06.2019 20:10
Suppose g(x) = f(x + 3) + 4. which statement best compares the graph of g(x) with the graph of f(x)?
Answers: 2
Mathematics, 21.06.2019 22:00
Which function in vertex form is equivalent to f(x) = x2 + 6x + 3? f(x) = (x + 3)2 + 3 f(x) = (x + 3)2 − 6 f(x) = (x + 6)2 + 3 f(x) = (x + 6)2 − 6
Answers: 1
Mathematics, 21.06.2019 22:30
What is the distance between a and b? round your answer to the nearest tenth. a coordinate plane is shown. point a is located at negative 1, 5, and point b is located at 4, 1. a line segment connects the two points.
Answers: 1
You know the right answer?
Questions


Social Studies, 04.11.2020 14:00


Arts, 04.11.2020 14:00
Mathematics, 04.11.2020 14:00

Mathematics, 04.11.2020 14:00
Mathematics, 04.11.2020 14:00
Social Studies, 04.11.2020 14:00
Mathematics, 04.11.2020 14:00
Mathematics, 04.11.2020 14:00

Business, 04.11.2020 14:00

History, 04.11.2020 14:00
Mathematics, 04.11.2020 14:00


