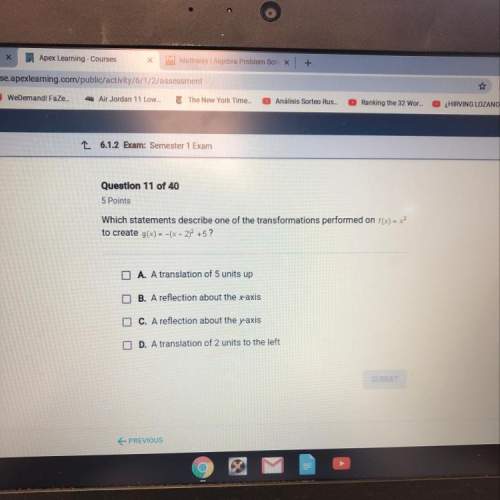
The graph shows the relationship between time and the number of soda bottles a
machine can mak...

Mathematics, 15.04.2020 20:56 tackmancalynn
The graph shows the relationship between time and the number of soda bottles a
machine can make. Use the points (4,176) and (8,352) to find the number of
soda bottles the machine can make each minute.

Answers: 3


Another question on Mathematics
Mathematics, 21.06.2019 18:30
Use δjkl and δmpn to determine whether don's claim is true or false. which of the following should don use to prove the triangles are similar? sss sas aas aa
Answers: 1
Mathematics, 21.06.2019 22:00
If abcde is reflected over the x-axis and then translated 3 units left, what are the new coordinates d? are he re
Answers: 1
You know the right answer?
Questions

Computers and Technology, 07.11.2021 09:40


Physics, 07.11.2021 09:40

English, 07.11.2021 09:40


