
Mathematics, 15.04.2020 23:44 alexsandra120505
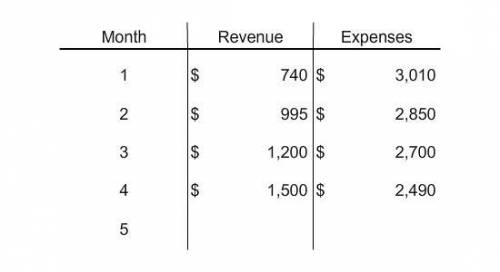
Graph the information presented in the table. Use that graph to predict the week that revenue will equal expenses for this small company.
Note: Revenue and Expenses are drawn on the vertical axis and Month is on the horizontal axis.

Answers: 1


Another question on Mathematics
Mathematics, 21.06.2019 15:30
What is the measure of angle z in this figure? enter your answer in the box. z = ° two intersection lines. all four angles formed by the intersecting lines are labeled. clockwise, the angles are labeled 43 degrees, x degrees, y degrees, and z degrees.
Answers: 3
Mathematics, 21.06.2019 18:10
Find the solution set of this inequality. enter your answer in interval notation using grouping symbols. |8x-4| ≤ 12
Answers: 1
Mathematics, 21.06.2019 19:50
Which statement is true? n is a point of tangency on circle p. pt is a secant of circle p. is a secant of circle p. vu is a tangent of circle p.
Answers: 3
Mathematics, 21.06.2019 20:40
The acceleration of an object due to gravity is 32 feet per second squared.what is acceleration due to gravity in inches per second squared?
Answers: 2
You know the right answer?
Graph the information presented in the table. Use that graph to predict the week that revenue will e...
Questions
Mathematics, 07.05.2020 08:01

English, 07.05.2020 08:01

Biology, 07.05.2020 08:01
Biology, 07.05.2020 08:01
Mathematics, 07.05.2020 08:01
Mathematics, 07.05.2020 08:01
Mathematics, 07.05.2020 08:01

Mathematics, 07.05.2020 08:01
Chemistry, 07.05.2020 08:01


