Consider the standard normal curve given.
A graph shows the horizontal axis numbered 20...

Mathematics, 15.04.2020 23:52 yourgirlmaya
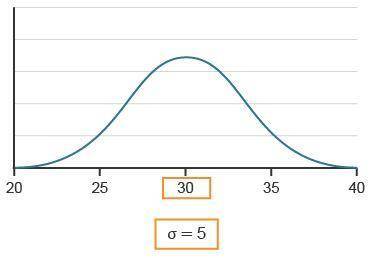
Consider the standard normal curve given.
A graph shows the horizontal axis numbered 20 to 40. 30 is highlighted in an orange outline. Variance = 5 and is highlighted in an orange outline. The line shows an upward trend to from 20 to 30 then a downward trend from 30 to 40.
The mean is __.
The standard deviation is __.
The data point 37 is __ one standard deviation from the mean.

Answers: 2


Another question on Mathematics
Mathematics, 21.06.2019 13:30
Describe the possible echelon forms of the standard matrix for a linear transformation t where t: set of real numbers is onto.
Answers: 2
Mathematics, 21.06.2019 21:30
Are the corresponding angles congruent? explain why or why not.
Answers: 2
Mathematics, 21.06.2019 23:00
700 miles the train takes 5 hours to a travel the distance at what unit rate is the train traveling?
Answers: 1
Mathematics, 21.06.2019 23:30
In the equation sqrt(n+5)-sqrt(11-10)=1. what is the value of n
Answers: 1
You know the right answer?
Questions

History, 28.06.2019 01:30

English, 28.06.2019 01:30
Mathematics, 28.06.2019 01:30
Mathematics, 28.06.2019 01:30
History, 28.06.2019 01:30

Biology, 28.06.2019 01:30
Biology, 28.06.2019 01:30
English, 28.06.2019 01:30
History, 28.06.2019 01:30


