
Mathematics, 17.04.2020 19:02 marianabeel230
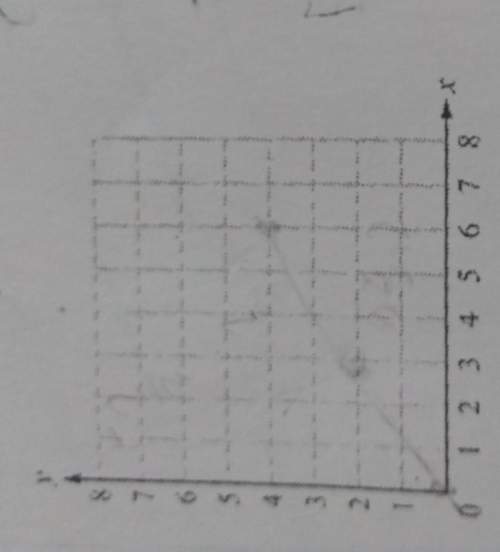
GIVING BRAINLIEST Which line best represents the line of best fit for this scatter plot? Graph shows numbers from 0 to 10 at increments of 1 on the x axis and numbers from 0 to 18 at increments of 2. Scatter plot shows ordered pairs 1, 1 and 2, 4 and 3, 12 and 4, 6 and 5, 8 and 6, 8 and 7, 12 and 8, 10 and 9, 14 and 10, 18. A line labeled P joins ordered pair 0, 1 and 9, 18. A line labeled Q joins ordered pairs 0, 1 and 10, 16. A line labeled R joins ordered pairs 0, 1 and 10, 10. A line labeled S joins ordered pairs 0, 1 and 10, 6. Line P Line Q Line R Line S

Answers: 3


Another question on Mathematics
Mathematics, 21.06.2019 18:00
Lydia collected two sets of data one set of data shows an outlier. which set has an outlier, and which number is the outlier?
Answers: 2
Mathematics, 21.06.2019 19:00
Solve the equation using the zero-product property. -3n(7n - 5) = 0 a. 0, -5/7 b. -1/3, -5/7 c. -1/3, 5/7 d. 0, 5/7
Answers: 2
Mathematics, 21.06.2019 20:00
Fred has a spinner that is split into four equal sections: red, blue, green, and yellow. fred spun the spinner 688 times. which of the following would be a good estimate of the number of times the spinner lands on the green section? a. 269 b. 603 c. 344 d. 189
Answers: 1
Mathematics, 22.06.2019 00:30
1.3.25 question suppose 40​% of all voters voted for a particular candidate. to simulate exit polls regarding whether or not voters voted for this​ candidate, five random samples of size 1010 and five random samples of size 10001000 have been generated using technology using a population proportion of 0.400.40​, with the accompanying results. complete parts a through c below. click the icon to view the simulation results. a. observe how the sample proportions of successes vary around 0.400.40. simulation compared to sample prop simulation compared to sample prop 1 ▾ 6 ▾ greater than 0.40 less than 0.40 equal to 0.40 2 ▾ less than 0.40 greater than 0.40 equal to 0.40 7 ▾ greater than 0.40 less than 0.40 equal to 0.40 3 ▾ greater than 0.40 less than 0.40 equal to 0.40 8 ▾ equal to 0.40 greater than 0.40 less than 0.40 4 ▾ greater than 0.40 equal to 0.40 less than 0.40 9 ▾ less than 0.40 greater than 0.40 equal to 0.40 5 ▾ equal to 0.40 less than 0.40 greater than 0.40 10 ▾ equal to 0.40 greater than 0.40 less than 0.40 click to select your answer(s) and then click check answer. 2 parts remaining clear all check answer
Answers: 3
You know the right answer?
GIVING BRAINLIEST Which line best represents the line of best fit for this scatter plot? Graph shows...
Questions

Physics, 06.07.2021 01:00


Mathematics, 06.07.2021 01:00
Mathematics, 06.07.2021 01:00

Mathematics, 06.07.2021 01:00

Mathematics, 06.07.2021 01:00
Chemistry, 06.07.2021 01:00
Chemistry, 06.07.2021 01:00
Mathematics, 06.07.2021 01:00
Mathematics, 06.07.2021 01:00


