
Mathematics, 19.04.2020 05:49 emilylol04173
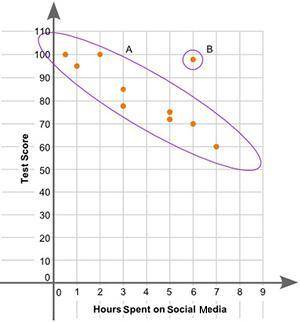
The scatter plot shows the relationship between the test scores of a group of students and the number of hours they spend on social media in a week:
Part A: What is the group of points labeled A called? What is the point labeled B called? Give a possible reason for the presence of point B. (3 points)
Part B: Describe the association between a student’s test scores and the number of hours spent on social media. (2 points)

Answers: 1


Another question on Mathematics
Mathematics, 21.06.2019 15:10
Aline parallel to a triangle's side splits ab into lengths of x - 5 and x + 2. the other side, ac, is split into lengths of x and x + 12. what is the length of ac? a) 12 b) 24 c) 36 d)
Answers: 1
Mathematics, 22.06.2019 00:30
Consider this expression and the steps to evaluate it. 4^5(−2)^9/4^8(−2)^3 1. apply the quotient of powers: (−2)^a/4^b 2. evaluate powers: c/d select the value of each variable. a = _ b = _ c = _ d = _
Answers: 3
You know the right answer?
The scatter plot shows the relationship between the test scores of a group of students and the numbe...
Questions

Mathematics, 15.07.2020 01:01
Mathematics, 15.07.2020 01:01


Mathematics, 15.07.2020 01:01

Mathematics, 15.07.2020 01:01
Mathematics, 15.07.2020 01:01


