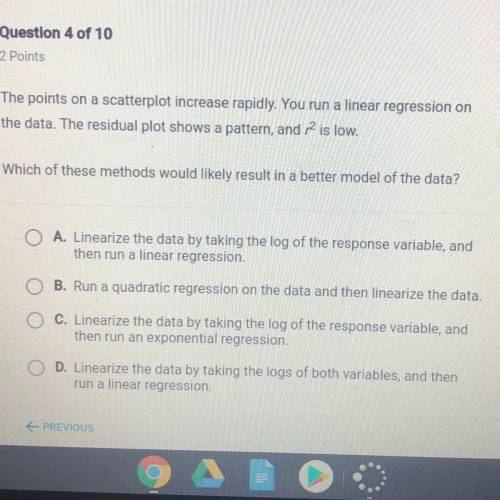
The points on a scatterplot increase rapidly. You run a linear regression on
the data. The res...

Mathematics, 19.04.2020 07:01 hann647
The points on a scatterplot increase rapidly. You run a linear regression on
the data. The residual plot shows a pattern, and R is low.
Which of these methods would likely result in a better model of the data?
HELP PLEASE ASAP


Answers: 1


Another question on Mathematics

Mathematics, 21.06.2019 12:30
Iam so stuck. what is the worked out answer for this question?
Answers: 1

Mathematics, 21.06.2019 20:50
Ms.ortiz sells tomatoes wholesale. the function p(x)=-80x^2+320x-10, graphed below, indicates how much profit she makes on a load of tomatoes if she makes on a load of tomatoes if she sells them for 4-x dollars per kilogram. what should ms.ortiz charge per kilogram of tomatoes to make on a load of tomatoes?
Answers: 2

Mathematics, 22.06.2019 00:30
Match the one-to-one functions with the graphs of their inverse functions.
Answers: 3

Mathematics, 22.06.2019 02:30
(fog)(x) if f(x)=x^2- 4 and g(x)=x^2 + 2 x, f(g(x))= f(x^2+2x) (x^2+2x)^2-4 (x^2+2x)(x^2+2x)-4 (x^4+2x^3+5x+4x^2)-4 x^4+2x^3+4x^2+5x-4 what am i doing wrong
Answers: 1
You know the right answer?
Questions


Computers and Technology, 29.10.2020 23:00

Mathematics, 29.10.2020 23:00

Mathematics, 29.10.2020 23:00

Mathematics, 29.10.2020 23:00

English, 29.10.2020 23:00

SAT, 29.10.2020 23:00


Biology, 29.10.2020 23:00

Mathematics, 29.10.2020 23:00

Mathematics, 29.10.2020 23:00

Mathematics, 29.10.2020 23:00


Mathematics, 29.10.2020 23:00

English, 29.10.2020 23:00

Computers and Technology, 29.10.2020 23:00


Mathematics, 29.10.2020 23:00

Chemistry, 29.10.2020 23:00


