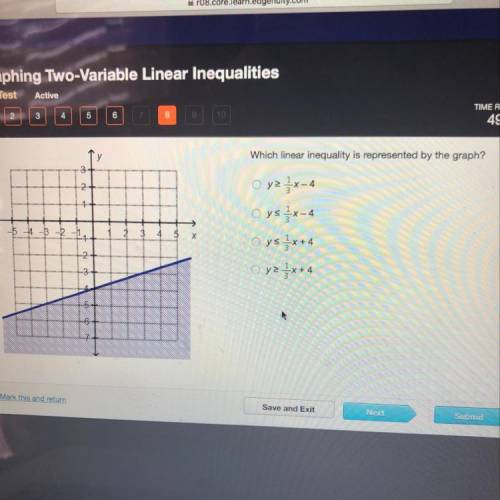
Which linear inequality is represented by the graph?
T3
2 +
+ + + +
5 -4 -3...

Mathematics, 19.04.2020 17:58 sloth53
Which linear inequality is represented by the graph?
T3
2 +
+ + + +
5 -4 -3 -2 -1
1
1
2
3
4
5
+2+
to.3
***
attend
fremgr eby to
wash
Mark this and return
Save and Exit
Next
Submit


Answers: 1


Another question on Mathematics

Mathematics, 21.06.2019 15:30
Avegetable garden and a surrounding path are shaped like a square that together are 11ft wide. the path is 2ft wide. find the total area of the vegetable garden and path
Answers: 1

Mathematics, 21.06.2019 18:30
Anew shopping mall is gaining in popularity. every day since it opened, the number of shoppers is 5% more than the number of shoppers the day before. the total number of shoppers over the first 10 days is 1258 how many shoppers were on the first day?
Answers: 2

Mathematics, 21.06.2019 19:00
Which shows the correct substitution of the values a,b and c from the equation 1=-2x+3x^2+1
Answers: 1

Mathematics, 21.06.2019 21:30
Zack notices that segment nm and segment pq are congruent in the image below: which step could him determine if δnmo ≅δpqr by sas? (5 points) segment mo ≅ segment qr segment on ≅ segment qp ∠ n ≅ ∠ r ∠ o ≅ ∠ q
Answers: 3
You know the right answer?
Questions

Computers and Technology, 30.11.2020 01:20


Mathematics, 30.11.2020 01:20

Computers and Technology, 30.11.2020 01:20


Biology, 30.11.2020 01:20

Biology, 30.11.2020 01:20


Mathematics, 30.11.2020 01:20

Geography, 30.11.2020 01:20


Social Studies, 30.11.2020 01:20


English, 30.11.2020 01:20

Mathematics, 30.11.2020 01:20

English, 30.11.2020 01:20


