Mathematics, 20.04.2020 00:13 love12236
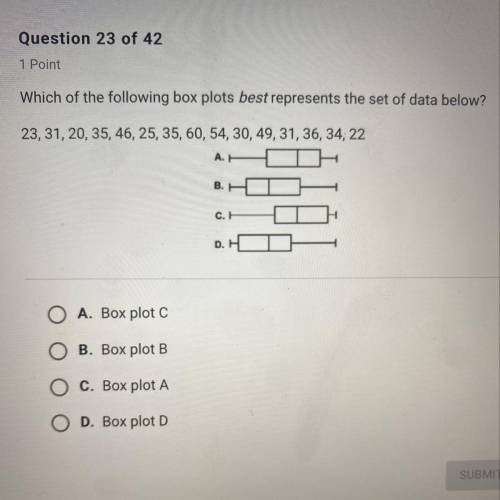
Which of the following box plots best represents the set of data below? 23, 31, 20, 35, 46, 25, 35, 60, 54, 30, 49, 31, 36, 34, 22.
A. Box plot C
B. Box plot B
C. Box plot A
D. Box plot D


Answers: 1


Another question on Mathematics

Mathematics, 21.06.2019 15:00
Need ! give step by step solutions on how to solve number one \frac{9-2\sqrt{3} }{12+\sqrt{3} } number two x+4=\sqrt{13x-20} number three (domain and range) f(x)=2\sqrt[3]{x} +1
Answers: 2

Mathematics, 21.06.2019 15:00
12 point are triangles pqr and stu congruent? what is the congruency that proves they are congruent? what is the perimeter of triangle pqr?
Answers: 2

Mathematics, 21.06.2019 20:40
Reduce fractions expressing probability to lowest terms. in 3,000 repetitions of an experiment, a random event occurred in 500 cases. the expected probability of this event is?
Answers: 3

Mathematics, 21.06.2019 21:10
Lines b and c are parallel. what is the measure of 2? m2 = 31° m2 = 50° m2 = 120° m2 = 130°
Answers: 2
You know the right answer?
Which of the following box plots best represents the set of data below? 23, 31, 20, 35, 46, 25, 35,...
Questions

Mathematics, 27.04.2021 22:30


Mathematics, 27.04.2021 22:30


Arts, 27.04.2021 22:30

Mathematics, 27.04.2021 22:30


Mathematics, 27.04.2021 22:30


