
Mathematics, 20.04.2020 18:00 williamabigan
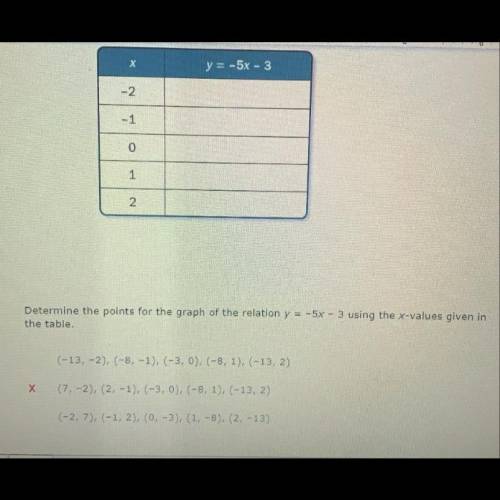
Determine the points for the graph of the relation y = -5x-3 using the x-values given in the table
A. (-13, -2), (-8 -1), (-3,0), (-8,1), (-13,2)
B. (7,-2) (2, -1), (-3,0), (-8,1), (-13,2)
C. (-2, 7), (-1, 2), (0, -3), (1, -8), (2,-13)

Answers: 1


Another question on Mathematics
Mathematics, 20.06.2019 18:04
You can model the population of a certain city between 1955-2000 by the radical function p(x)=55,000 sqrt x-1945. using this model, in which year was the population of that city 220,000
Answers: 1
Mathematics, 21.06.2019 23:00
Y= 4x + 3 y = - 1 4 x - 5 what is the best description for the lines represented by the equations?
Answers: 1
You know the right answer?
Determine the points for the graph of the relation y = -5x-3 using the x-values given in the table <...
Questions


History, 23.06.2019 18:00
Mathematics, 23.06.2019 18:00


Chemistry, 23.06.2019 18:00

Geography, 23.06.2019 18:00
Biology, 23.06.2019 18:00
Biology, 23.06.2019 18:00
Mathematics, 23.06.2019 18:00


