
Mathematics, 21.04.2020 20:47 duyphan
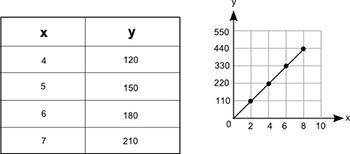
The table and the graph below each show a different relationship between the same two variables, x and y:
How much more would the value of y be on the graph than its value in the table when x = 12?
150
300
450
600

Answers: 2


Another question on Mathematics
Mathematics, 21.06.2019 16:30
What is the fewest number of full weeks briyana would have to work to have enough money? 8 weeks9 weeks 10 weeks11 weeks
Answers: 1
Mathematics, 21.06.2019 21:00
Circle a has a diameter of 7 inches, a circumference of 21.98 inches, and an area of 38.465 square inches. the diameter of circle b is 6 inches, the circumference is 18.84 inches, and the area is 28.26 square inches. part a: using the formula for circumference, solve for the value of pi for each circle. (4 points) part b: use the formula for area and solve for the value of pi for each circle. (4 points)
Answers: 2
Mathematics, 22.06.2019 03:30
The diameter of the moon is about 3500 km. approximate the surface area of the moon using the formula for the surface area of a sphere, s = 4πr2. write your answer in scientific notation.
Answers: 1
Mathematics, 22.06.2019 04:00
Acommunity group is building a garden on a rectangular lot of land. the lot measures 5x by 10x and the garden will be circular with a radius of 3x. how much of the land will be left over after the garden is built? a. 41 pi x^2 b. x^2 (50 - 9 pi) c. x^2 (50 - 3 pi) d. 41x^2
Answers: 1
You know the right answer?
The table and the graph below each show a different relationship between the same two variables, x a...
Questions


Chemistry, 20.03.2020 11:49
Mathematics, 20.03.2020 11:50
Mathematics, 20.03.2020 11:50


History, 20.03.2020 11:50

English, 20.03.2020 11:50

Biology, 20.03.2020 11:51
Mathematics, 20.03.2020 11:51

Biology, 20.03.2020 11:51


