
Mathematics, 21.04.2020 23:59 ginareyes0423
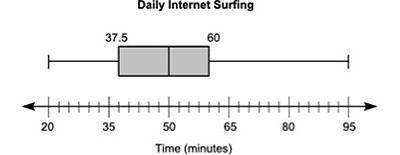
The box plot below shows the total amount of time, in minutes, the students of a class surf the Internet every day:
A box plot is shown. The left-most point on the plot is 20 and the right-most point is 95. The box is labeled 37.5 on the left edge and 60 on the right edge. A vertical line is drawn inside the rectangle at the point 50.
Part A: List two pieces of information that are provided by the graph and one piece of information that is not provided by the graph. (4 points)
Part B: Calculate the interquartile range of the data, and explain in a sentence or two what it represents. (4 points)
Part C: Explain what affect, if any, there will be if an outlier is present. (2 points)

Answers: 1


Another question on Mathematics
Mathematics, 21.06.2019 19:00
Find the length of the diagonal of the rectangle. round your answer to the nearest tenth. || | | 8 m | | | | 11 m
Answers: 2
Mathematics, 21.06.2019 22:30
Sketch the vector field vector f( vector r ) = 8vector r in the xy-plane. select all that apply. the length of each vector is 8. the lengths of the vectors decrease as you move away from the origin. all the vectors point away from the origin. all the vectors point in the same direction. all the vectors point towards the origin. the lengths of the vectors increase as you move away from the origin.
Answers: 2
You know the right answer?
The box plot below shows the total amount of time, in minutes, the students of a class surf the Inte...
Questions

Biology, 21.12.2020 17:30


Advanced Placement (AP), 21.12.2020 17:30


Mathematics, 21.12.2020 17:30
Mathematics, 21.12.2020 17:30
Mathematics, 21.12.2020 17:30


Computers and Technology, 21.12.2020 17:30


