
Mathematics, 22.04.2020 02:38 coolman12062
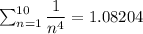
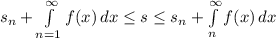
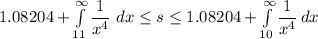
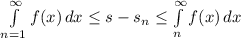
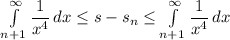
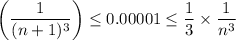
Consider the following series. [infinity] 1 n4 n = 1 (a) Use the sum of the first 10 terms to estimate the sum of the given series. (Round the answer to six decimal places.) s10 = (b) Improve this estimate using the following inequalities with n = 10. (Round your answers to six decimal places.) sn + [infinity] f(x) dx n + 1 ≤ s ≤ sn + [infinity] f(x) dx n ≤ s ≤ (c) Using the Remainder Estimate for the Integral Test, find a value of n that will ensure that the error in the approximation s ≈ sn is less than 0.00001. n > 32 n > −32 n > 5 n > 0 n > 15

Answers: 1


Another question on Mathematics
Mathematics, 21.06.2019 15:00
Alake near the arctic circle is covered by a 222-meter-thick sheet of ice during the cold winter months. when spring arrives, the warm air gradually melts the ice, causing its thickness to decrease at a constant rate. after 333 weeks, the sheet is only 1.251.251, point, 25 meters thick. let s(t)s(t)s, left parenthesis, t, right parenthesis denote the ice sheet's thickness sss (measured in meters) as a function of time ttt (measured in weeks).
Answers: 1
Mathematics, 21.06.2019 16:00
Part one: measurements 1. measure your own height and arm span (from finger-tip to finger-tip) in inches. you will likely need some from a parent, guardian, or sibling to get accurate measurements. record your measurements on the "data record" document. use the "data record" to you complete part two of this project. name relationship to student x height in inches y arm span in inches archie dad 72 72 ginelle mom 65 66 sarah sister 64 65 meleah sister 66 3/4 67 rachel sister 53 1/2 53 emily auntie 66 1/2 66 hannah myself 66 1/2 69 part two: representation of data with plots 1. using graphing software of your choice, create a scatter plot of your data. predict the line of best fit, and sketch it on your graph. part three: the line of best fit include your scatter plot and the answers to the following questions in your word processing document 1. 1. which variable did you plot on the x-axis, and which variable did you plot on the y-axis? explain why you assigned the variables in that way. 2. write the equation of the line of best fit using the slope-intercept formula $y = mx + b$. show all your work, including the points used to determine the slope and how the equation was determined. 3. what does the slope of the line represent within the context of your graph? what does the y-intercept represent? 5. use the line of best fit to you to describe the data correlation.
Answers: 2
Mathematics, 21.06.2019 21:50
Which is the graph of this function 3 square root of x plus one if
Answers: 1
You know the right answer?
Consider the following series. [infinity] 1 n4 n = 1 (a) Use the sum of the first 10 terms to estima...
Questions
Mathematics, 11.06.2021 03:20

Biology, 11.06.2021 03:20
Mathematics, 11.06.2021 03:20


Computers and Technology, 11.06.2021 03:20

Mathematics, 11.06.2021 03:20
Mathematics, 11.06.2021 03:20
Mathematics, 11.06.2021 03:20

Mathematics, 11.06.2021 03:20
English, 11.06.2021 03:20
Mathematics, 11.06.2021 03:20
Mathematics, 11.06.2021 03:20


