A small class took a survey of the number of siblings
each student has. The data are shown in...

Mathematics, 22.04.2020 17:25 jay13212
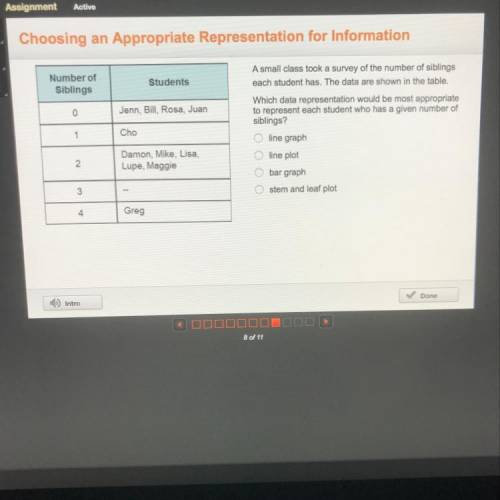
A small class took a survey of the number of siblings
each student has. The data are shown in the table.
Which data representation would be most appropriate
to represent each student who has a given number of
siblings?
line graph
line plot
bar graph
stem and leaf plot

Answers: 2


Another question on Mathematics
Mathematics, 21.06.2019 21:30
Suppose babies born after a gestation period of 32 to 35 weeks have a mean weight of 25002500 grams and a standard deviation of 800800 grams while babies born after a gestation period of 40 weeks have a mean weight of 27002700 grams and a standard deviation of 385385 grams. if a 3232-week gestation period baby weighs 21252125 grams and a 4040-week gestation period baby weighs 23252325 grams, find the corresponding z-scores. which baby weighs lessless relative to the gestation period?
Answers: 1
Mathematics, 21.06.2019 22:00
Determine if the equation defines y as a function of x: 2xy = 1. yes o no
Answers: 2
Mathematics, 21.06.2019 22:30
Which expressions equal 9 when x=4 and y=1/3 a. x2+6y b. 2x + 3y c. y2-21x d. 5 (x/2) -3y e. 3x-9y
Answers: 2
You know the right answer?
Questions
Mathematics, 19.02.2020 03:58


Computers and Technology, 19.02.2020 03:58

History, 19.02.2020 03:58

Computers and Technology, 19.02.2020 03:58


