
Mathematics, 22.04.2020 23:15 lukeperry
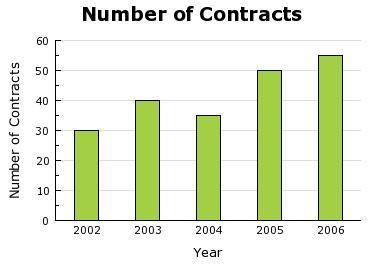
The bar graph shows the number of contracts Company X gained each year from 2002 to 2006. Over which of the periods was the average rate of increase for number of Contracts for Company X the smallest?
A) From 2002 through 2003
B) From 2002 through 2004
C) From 2004 through 2005
D) From 2004 through 2006

Answers: 3


Another question on Mathematics
Mathematics, 21.06.2019 12:30
(note i put the graph in so plz )the graph shows the amount of water that remains in a barrel after it begins to leak. the variable x represents the number of days that have passed since the barrel was filled, and y represents the number of gallons of water that remain in the barrel. what is the slope of the line
Answers: 1
Mathematics, 21.06.2019 16:00
Weak battery is considered to be a part of routine a. inspection b. wear and tear c. maintenance d. check
Answers: 2
Mathematics, 21.06.2019 20:00
An investment decreases in value by 30% in the first year and decreases by 40% in the second year. what is the percent decrease in percentage in the investment after two years
Answers: 1
Mathematics, 21.06.2019 21:30
The owner of the plant nursery where you were tells you to fill 350 ml bottles from a 30 l from a fertilizer
Answers: 1
You know the right answer?
The bar graph shows the number of contracts Company X gained each year from 2002 to 2006. Over which...
Questions

Biology, 26.07.2019 01:30


Mathematics, 26.07.2019 01:30

Mathematics, 26.07.2019 01:30

History, 26.07.2019 01:30
Mathematics, 26.07.2019 01:30
Biology, 26.07.2019 01:30
Mathematics, 26.07.2019 01:30


