HuUuRrY!
A survey asked eight students about their scores on a history test and whether t...

Mathematics, 22.04.2020 21:40 BluedragonKBT44
HuUuRrY!
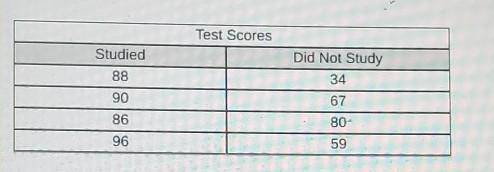
A survey asked eight students about their scores on a history test and whether they studied for the test. The table shows the results of the survey. Which statements about the data sets are true? Check all that apply.
The mean absolute deviation for the group of students who studied is 12.
The mean absolute deviation for the group of students who did not study is 13.5.
The data for the group that studied are more spread out than the data for the group that did not study.
TELE
-
The data for the group that did not study are more spread out than the data for the group that studied.
D
The data for the group that studied are more clustered around the mean than the data for the group that did not study.
The data for the group that did not study are more clustered around the mean than the data for the group that did study.

Answers: 1


Another question on Mathematics
Mathematics, 21.06.2019 18:30
The length of a rectangle is x times the square root of 100. the width is one-half y more than three-halves x. given that the area of the rectangle is 125 cm2, which equation could represent the rectangle in terms of x and y? a) 5xy − 15x = 125 b) 5xy + 15x = 125 c) 15x2 − 5xy = 125 d) 15x2 + 5xy = 125
Answers: 2
Mathematics, 21.06.2019 19:30
John checked his watch and said that it is thursday, 7 am. what will the day and time be 2006 hours plzzz i will give you 100 points
Answers: 1
You know the right answer?
Questions

Biology, 18.04.2020 20:49

Mathematics, 18.04.2020 20:49

Social Studies, 18.04.2020 20:49
Mathematics, 18.04.2020 20:49
Mathematics, 18.04.2020 20:49
Law, 18.04.2020 20:49

Chemistry, 18.04.2020 20:50

History, 18.04.2020 20:50
History, 18.04.2020 20:50
Mathematics, 18.04.2020 20:50
Biology, 18.04.2020 20:50


English, 18.04.2020 20:50
Mathematics, 18.04.2020 20:50


