
Mathematics, 05.10.2019 09:00 paigeleahfarbeoy2ork
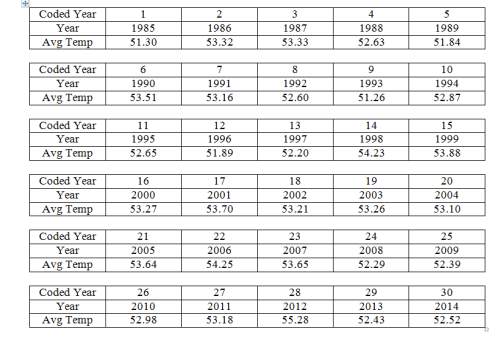
Here are the average global temperatures for the contiguous united states over the last 30 years (measured in of). use the table in the image below to answer the 5 questions that come with it.
1. statistical regression can be sensitive to relatively large numbers. to simplify these numbers, recode each year so that 1985 is coded as year 1 and 2014 is coded as year 30.
2. on a separate page, make a time plot of this data (horizontal axis = coded year,
vertical axis = average temperature). do not connect the dots.
3. using technology, find the regression line that best fits this data. report your result in the form
average temp = + (coded year)
4. what average temperature does your regression equation predict for the year 1997?
5. what was the actual average temperature in the year 1997?

Answers: 1


Another question on Mathematics
Mathematics, 21.06.2019 15:30
Consider the integral: 4 0 16 − y2 − 16 − y2 4 1 x2 + y2 dz dx dy . (a) describe w. use the standard view of the x, y, and z axes. front half of a cone with a rounded top. full cone with a flat top. right half of a cone with a flat top. front half of a cone with a flat top. right half of a cone with a rounded top.
Answers: 1
Mathematics, 21.06.2019 17:00
Select all of the quadrants that the parabola whose equation is y=√x-4 (principal square root) occupies. i ii iii iv
Answers: 3
Mathematics, 22.06.2019 01:40
Which of the following is the major negative aspect of crossover designs for research studies? a. prohibitive cost b. residual effects c-subject drepout d. incomplete randomization e. large sample size required
Answers: 1
You know the right answer?
Here are the average global temperatures for the contiguous united states over the last 30 years (me...
Questions

Chemistry, 05.09.2019 16:10
Mathematics, 05.09.2019 16:10

Chemistry, 05.09.2019 16:10
Mathematics, 05.09.2019 16:10
Mathematics, 05.09.2019 16:10


