


Assume you have collected data pairs (x, y) on a certain variety of tree. x is
the number of w...

Mathematics, 23.04.2020 18:23 sarah5707
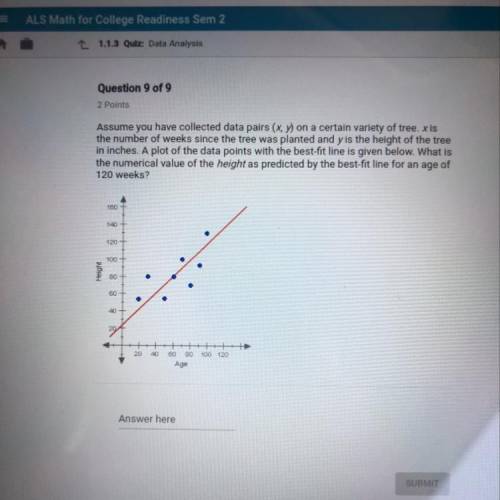
Assume you have collected data pairs (x, y) on a certain variety of tree. x is
the number of weeks since the tree was planted and yis the height of the tree
in inches. A plot of the data points with the best-fit line is given below. What is
the numerical value of the height as predicted by the best-fit line for an age of
120 weeks?

Answers: 3


Another question on Mathematics
Mathematics, 21.06.2019 18:30
How do you create a data set with 8 points in it that has a mean of approximately 10 and a standard deviation of approximately 1?
Answers: 1
Mathematics, 21.06.2019 19:00
What is the volume of a cone with a height of 6 cm in the radius of 2 cm
Answers: 1
Mathematics, 21.06.2019 19:50
Drag each tile into the correct box. not all tiles will be used. find the tables with unit rates greater than the unit rate in the graph. then tenge these tables in order from least to greatest unit rate
Answers: 2
Mathematics, 21.06.2019 20:00
You are shooting hoops after school and make 152 out of a total of 200. what percent of shots did you make? what percent did you miss? show proportion(s).
Answers: 1
You know the right answer?
Questions


Computers and Technology, 12.11.2019 01:31
Computers and Technology, 12.11.2019 01:31


