
Mathematics, 23.04.2020 19:28 lexus7493
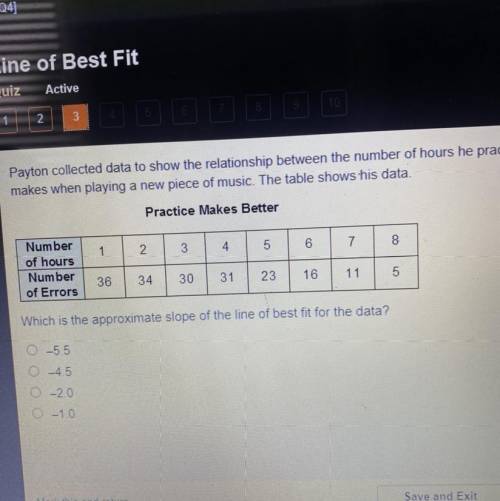
Peyton collected data to show the relationship between the number of hours he practices and the number of areas he makes him playing a new piece of music The table shows his data which is the approximate slope of the line of best fit for the data

Answers: 2


Another question on Mathematics
Mathematics, 21.06.2019 12:30
Jackson drew 4 hearts and 29 circles. what is the ratio of circles to all shapes?
Answers: 1
Mathematics, 21.06.2019 18:00
What is the relationship between all triangles that can be drawn given the same three angles
Answers: 2
Mathematics, 22.06.2019 01:00
The computer that controls a bank's automatic teller machine crashes a mean of 0.6 times per day. what is the probability that, in any seven-day week, the computer will crash less than 5 times? round your answer to four decimal places
Answers: 2
You know the right answer?
Peyton collected data to show the relationship between the number of hours he practices and the numb...
Questions

Biology, 22.08.2021 14:00

English, 22.08.2021 14:00

Computers and Technology, 22.08.2021 14:00


Social Studies, 22.08.2021 14:00


Business, 22.08.2021 14:00

Chemistry, 22.08.2021 14:00
English, 22.08.2021 14:00
Mathematics, 22.08.2021 14:00
History, 22.08.2021 14:00
Business, 22.08.2021 14:00
Mathematics, 22.08.2021 14:00
English, 22.08.2021 14:00
English, 22.08.2021 14:00


