Mathematics, 23.04.2020 21:58 alissa64
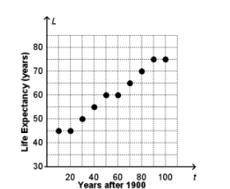
The scatter plot shows the relationship between the time t, in years after 1900, and the life expectancy, in years, at birth for a certain country.
Which of the following statements best describes the data on the scatter plot?
A. The data on the scatterplot suggests a linear association that could be modeled by the function
L(t) = 39.67t + 0.37.
B. The data on the scatterplot suggests a linear association that could be modeled by the function
L(t) = -0.24t + 74.33.
C. The data on the scatterplot suggests a linear association that could be modeled by the function
L(t) = 0.37t + 39.67.
D. The data on the scatter plot does not suggest a linear association, so it cannot be modeled by a linear
function.


Answers: 2


Another question on Mathematics

Mathematics, 21.06.2019 18:00
John read the first 114 pages of a novel, which was 3 pages less than 1/3 of the novel. write an equation to determine the total number of pages (p)(p) in the novel.
Answers: 1

Mathematics, 21.06.2019 19:00
Billy plotted −3 4 and −1 4 on a number line to determine that −3 4 is smaller than −1 4 is he correct? explain why or why not?
Answers: 3

Mathematics, 21.06.2019 19:00
Atheater wants to build movable steps that they can use to go on and off the stage. they want the steps to have enough space inside so they can also be used to store props. how much space is inside the steps?
Answers: 1

Mathematics, 21.06.2019 19:40
Afactory makes propeller drive shafts for ships. a quality assurance engineer at the factory needs to estimate the true mean length of the shafts. she randomly selects four drive shafts made at the factory, measures their lengths, and finds their sample mean to be 1000 mm. the lengths are known to follow a normal distribution whose standard deviation is 2 mm. calculate a 95% confidence interval for the true mean length of the shafts. input your answers for the margin of error, lower bound, and upper bound.
Answers: 3
You know the right answer?
The scatter plot shows the relationship between the time t, in years after 1900, and the life expect...
Questions

Mathematics, 06.12.2019 23:31


Geography, 06.12.2019 23:31


Mathematics, 06.12.2019 23:31

Chemistry, 06.12.2019 23:31


Mathematics, 06.12.2019 23:31


Mathematics, 06.12.2019 23:31


