
Mathematics, 24.04.2020 01:33 culbertchristi4887
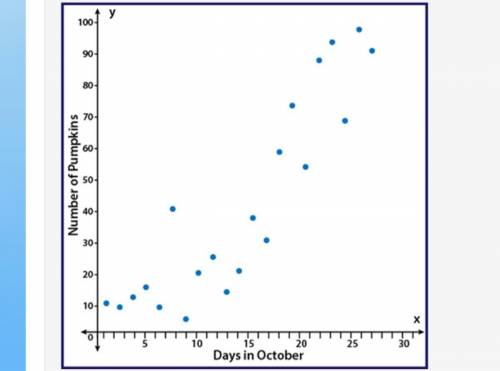
The scatter plot shows the number of pumpkins that have been picked on the farm during the month of October:
Part A: Using computer software, a correlation coefficient of r = 0.51 was calculated. Based on the scatter plot, is that an accurate value for this data? Why or why not? (5 points)
Part B: Instead of comparing the number of pumpkins picked and the day in October, write a scenario that would be a causal relationship for pumpkins picked on the farm. (5 points)

Answers: 1


Another question on Mathematics
Mathematics, 21.06.2019 15:40
Need ! discuss how to convert the standard form of the equation of a circle to the general form. 50 points
Answers: 1
Mathematics, 21.06.2019 16:00
The table shows values for functions f(x) and g(x) . x f(x)=3x g(x)=2x+1 −2 19 −3 −1 13 −1 0 1 1 1 3 3 2 9 5 what is the solution to f(x)=g(x) ? select each correct answer.
Answers: 1
Mathematics, 21.06.2019 18:00
Does anyone know how to do geometryme with this problem
Answers: 1
Mathematics, 22.06.2019 01:00
Sioux co. replaced the roof on its existing building, therefore increasing the building's life by 10 years. the cost of the roof is considered a(n):
Answers: 3
You know the right answer?
The scatter plot shows the number of pumpkins that have been picked on the farm during the month of...
Questions

History, 05.10.2019 01:00

Biology, 05.10.2019 01:00


Social Studies, 05.10.2019 01:00

Geography, 05.10.2019 01:00
Mathematics, 05.10.2019 01:00

Health, 05.10.2019 01:00
English, 05.10.2019 01:00
Social Studies, 05.10.2019 01:00
History, 05.10.2019 01:00
Social Studies, 05.10.2019 01:00
Mathematics, 05.10.2019 01:00

Mathematics, 05.10.2019 01:00
Mathematics, 05.10.2019 01:00


