
Mathematics, 24.04.2020 18:28 Raekwon3232
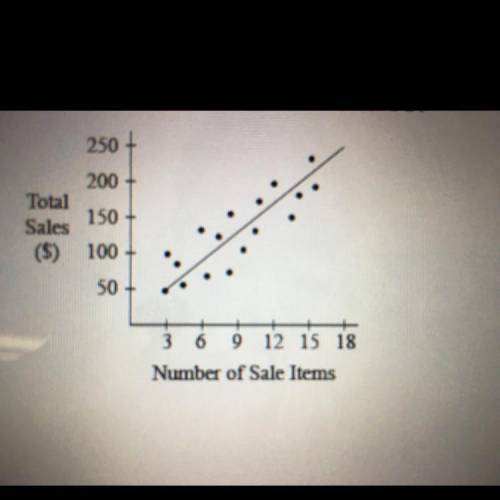
The graph below describes the relationship between total sales and the number of sale items in certain stores. Based on the line of best fit, predict total sales when the number of sale items is 18.
A.$109
B.$150
C.$200
D.$250

Answers: 1


Another question on Mathematics
Mathematics, 21.06.2019 20:40
Describe the symmetry of the figure. identify lines of symmetry, if any. find the angle and the order of any rotational symmetry.
Answers: 1
Mathematics, 21.06.2019 21:30
At the county fair, the baxter family bought 6 hot dogs and 4 juice drinks for $12.90. the farley family bought 3 hot dogs and 4 juice drinks for $8.55. find the price of a hot dog and the price of a juice drink.
Answers: 1
Mathematics, 22.06.2019 00:30
Jan accidently ran 7 minutes longer than he was supposed to. write an expression for the total amount of time jan ran if she was supposed to run m minutes
Answers: 1
Mathematics, 22.06.2019 00:50
To diagonalize an nxn matrix a means to find an invertible matrix p and a diagonal matrix d such that a pdp d p ap or [1 3 dh epap 3 let a=-3 -5 -3 3 3 1 step 1: find the eigenvalues of matrix a "2's" step 2: find the corresponding eigenvectors of a step 3: createp from eigenvectors in step 2 step 4 create d with matching eigenvalues.
Answers: 3
You know the right answer?
The graph below describes the relationship between total sales and the number of sale items in certa...
Questions
Mathematics, 10.12.2021 19:40


English, 10.12.2021 19:40
English, 10.12.2021 19:40

Biology, 10.12.2021 19:40
Mathematics, 10.12.2021 19:40
Mathematics, 10.12.2021 19:40
English, 10.12.2021 19:40


Business, 10.12.2021 19:40


