PLEASE ANSWER
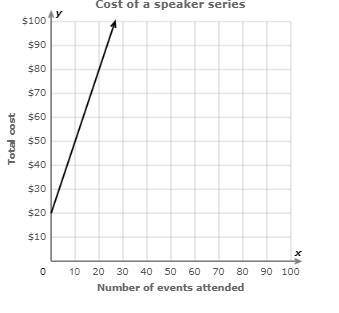
This graph shows how the total cost of a members-only speaker series is re...

Mathematics, 24.04.2020 20:18 cece3467
PLEASE ANSWER
This graph shows how the total cost of a members-only speaker series is related to the number of events attended.
What is the rate of change?
$___per event

Answers: 3


Another question on Mathematics
Mathematics, 21.06.2019 17:10
The average number of vehicles waiting in line to enter a parking lot can be modeled by the function f left parenthesis x right x squared over 2 left parenthesis 1 minus x right parenthesis endfraction , where x is a number between 0 and 1 known as the traffic intensity. find the rate of change of the number of vehicles waiting with respect to the traffic intensity for the intensities (a) xequals0.3 and (b) xequals0.6.
Answers: 1
Mathematics, 21.06.2019 19:30
Asurvey of 45 teens found that they spent an average of 25.6 hours per week in front of a screen (television, computer, tablet, phone, based on the survey’s sample mean, which value could be the population mean? 2.3 hours 27.4 hours 75.3 hours 41.5 hours
Answers: 1
Mathematics, 21.06.2019 21:00
Rewrite the following quadratic functions in intercept or factored form. show your work. y = 4x^2 - 19x- 5
Answers: 2
You know the right answer?
Questions

Arts, 21.02.2021 14:00

Mathematics, 21.02.2021 14:00

English, 21.02.2021 14:00
English, 21.02.2021 14:00

Geography, 21.02.2021 14:00

Physics, 21.02.2021 14:00
Mathematics, 21.02.2021 14:00
Physics, 21.02.2021 14:00
Chemistry, 21.02.2021 14:00

Biology, 21.02.2021 14:00

Biology, 21.02.2021 14:00
Mathematics, 21.02.2021 14:00
Mathematics, 21.02.2021 14:00
English, 21.02.2021 14:00

World Languages, 21.02.2021 14:00


