
Mathematics, 24.04.2020 20:36 catsareokiguess
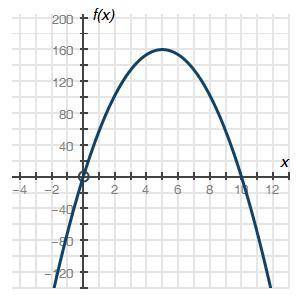
The graph below shows a company's profit f(x), in dollars, depending on the price of pencils x, in dollars, sold by the company:
Graph of quadratic function f of x having x intercepts at ordered pairs negative 0, 0 and 10, 0. The vertex is at 5, 160.
Part A: What do the x-intercepts and maximum value of the graph represent? What are the intervals where the function is increasing and decreasing, and what do they represent about the sale and profit? (4 points)
Part B: What is an approximate average rate of change of the graph from x = 2 to x = 5, and what does this rate represent? (3 points)
Part C: Describe the constraints of the domain. (3 points)

Answers: 3


Another question on Mathematics
Mathematics, 21.06.2019 17:30
Acircle has a radius of 5/6 units and is centered at (3.6, 7.8) write the equation of this circle
Answers: 1
Mathematics, 21.06.2019 21:50
Solve the following pair of equations for x and y: ax/b_ by /a= a +b; ax - by = 2ab
Answers: 2
Mathematics, 22.06.2019 00:00
4. bob solved the inequality problem below incorrectly. explain his error and redo the problem showing the correct answer. −2x + 5 < 17 −2x + 5-5 < 17-5 -2x/-2 < 12/-2 x < -6
Answers: 2
Mathematics, 22.06.2019 00:30
The length of a rectangle plus its width is 24 cm. the area is 143 square cm. what are the length and width of the rectangle?
Answers: 1
You know the right answer?
The graph below shows a company's profit f(x), in dollars, depending on the price of pencils x, in d...
Questions

Physics, 29.06.2019 04:00

History, 29.06.2019 04:00

Mathematics, 29.06.2019 04:00


Chemistry, 29.06.2019 04:00
Biology, 29.06.2019 04:00

Computers and Technology, 29.06.2019 04:00
Computers and Technology, 29.06.2019 04:00
Mathematics, 29.06.2019 04:00
Mathematics, 29.06.2019 04:00


