
Mathematics, 24.04.2020 21:54 igtguith
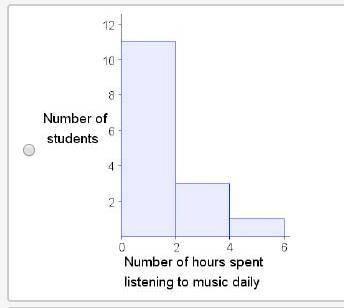
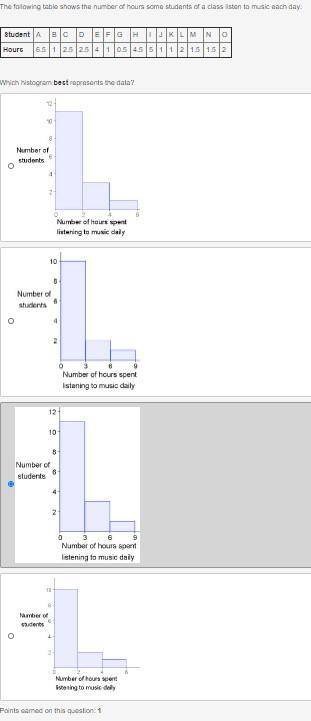
The following table shows the number of hours some students of a class listen to music each day:
Student A B C D E F G H I J K L M N O
Hours 6.5 1 2.5 2.5 4 1 0.5 4.5 5 1 1 2 1.5 1.5 2
Which histogram best represents the data?
A - picture 1 below
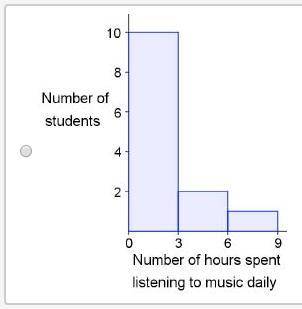
B - picture 2 below
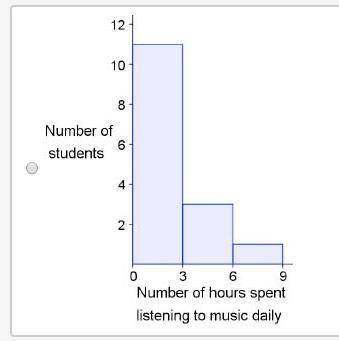
C - picture 3 below
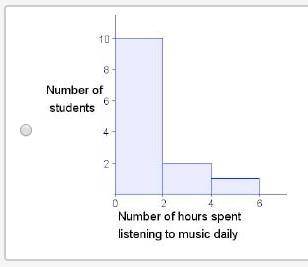
D - picture 4 below

Answers: 2


Another question on Mathematics
Mathematics, 21.06.2019 14:00
Ben bowled 124 and 188 in his first two games. what must he bowl in his third game to have an average of at least 160?
Answers: 1
Mathematics, 21.06.2019 19:00
1) what is the measure of the exterior angle, ∠uvw ? 2) in triangle man, what is the measure of the exterior angle at n (in degrees)?
Answers: 1
Mathematics, 21.06.2019 19:30
Plz.yesterday, the snow was 2 feet deep in front of archie’s house. today, the snow depth dropped to 1.6 feet because the day is so warm. what is the percent change in the depth of the snow?
Answers: 1
Mathematics, 22.06.2019 00:00
The cost of a taxi ride includes an initial charge of $2.00. if a 5km ride cost $6.00 and a 10km ride cost $10.00, determine the cost of a 15km ride.
Answers: 1
You know the right answer?
The following table shows the number of hours some students of a class listen to music each day:
Questions


English, 09.06.2021 17:00

History, 09.06.2021 17:00

Mathematics, 09.06.2021 17:00

Arts, 09.06.2021 17:00
Mathematics, 09.06.2021 17:00
Mathematics, 09.06.2021 17:00
English, 09.06.2021 17:00
Mathematics, 09.06.2021 17:00
English, 09.06.2021 17:00

English, 09.06.2021 17:00


