
Mathematics, 25.04.2020 11:20 taibamah
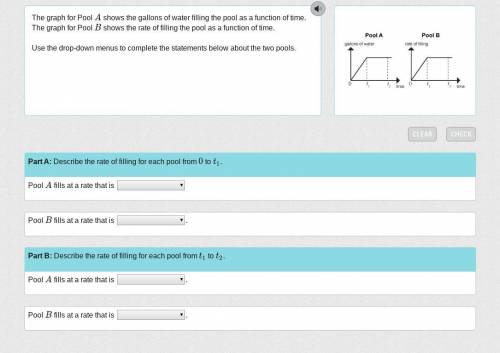
The graph for Pool A shows the gallons of water filling the pool as a function of time. The graph for Pool B shows the rate filling the pool as a function of time.
Part A: Describe the rate of filling for each pool from 0 to t1.
#1 Part A: Pool A fills at a rate that is
a. increasing
b. decreasing
c. 0
d. constant but 0
#2 Part A: Pool B fills at a rate that is
a. increasing
b. decreasing
c. 0
d. constant but 0
Part B: Describe the rate of filling for each pool from t1 to t2.
#3 Part B: Pool A fills at a rate that is
a. increasing
b. decreasing
c. 0
d. constant but 0
#4 Part B: Pool B fills at a rate that is
a. increasing
b. decreasing
c. 0
d. constant but 0

Answers: 3


Another question on Mathematics
Mathematics, 21.06.2019 18:00
The sat and act tests use very different grading scales. the sat math scores follow a normal distribution with mean 518 and standard deviation of 118. the act math scores follow a normal distribution with mean 20.7 and standard deviation of 5. suppose regan scores a 754 on the math portion of the sat. how much would her sister veronica need to score on the math portion of the act to meet or beat regan's score?
Answers: 1
Mathematics, 21.06.2019 22:10
Gravel is being dumped from a conveyor belt at a rate of 25 ft3/min, and its coarseness is such that it forms a pile in the shape of a cone whose base diameter and height are always equal. how fast is the height of the pile increasing when the pile is 14 ft high? (round your answer to two decimal places.) ft/min
Answers: 3
Mathematics, 22.06.2019 03:30
Sections of prefabricated woods are each 5 1/3 feet long, how long are 7 1/2 sections placed end to end?
Answers: 3
Mathematics, 22.06.2019 04:00
The graph shows the first four ordered pairs formed by the corresponding terms of two patterns. which ordered pair would be the fifth point on this graph? a. 12,8 b. 12,4 c. 10,4 d. 4,12
Answers: 1
You know the right answer?
The graph for Pool A shows the gallons of water filling the pool as a function of time. The graph fo...
Questions
Mathematics, 06.01.2020 20:31
Mathematics, 06.01.2020 20:31

English, 06.01.2020 20:31
Mathematics, 06.01.2020 20:31
Mathematics, 06.01.2020 20:31


Business, 06.01.2020 20:31

Engineering, 06.01.2020 20:31

Social Studies, 06.01.2020 20:31


