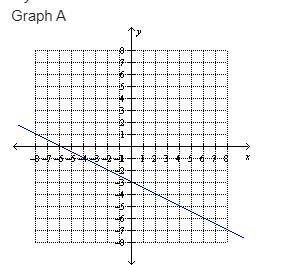
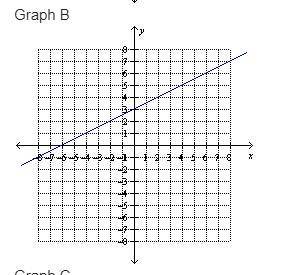
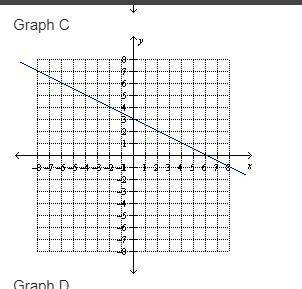
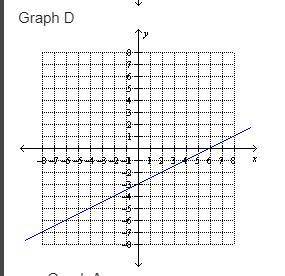
Choose the best graph that represents the linear equation:
-2y = x + 6
...

Mathematics, 26.04.2020 14:25 hardwick744
Choose the best graph that represents the linear equation:
-2y = x + 6

Answers: 2


Another question on Mathematics
Mathematics, 21.06.2019 15:30
According to statistics a person will devote 32 years to sleeping and watching tv. the number of years sleeping will exceed the number of years watching tv by 18. over a lifetime, how many years will the person spend on each of these activities
Answers: 1
Mathematics, 21.06.2019 20:00
Donald has x twenty-dollar bills and 11 ten-dollar bill. how much money does donald have? write your answer as an expression.
Answers: 2
Mathematics, 21.06.2019 22:00
In dire need~! describe how to use area models to find the quotient 2/3 divided by 1/5. check your work by also finding the quotient 2/3 divided by 1/5 using numerical operations only.
Answers: 3
Mathematics, 22.06.2019 02:20
Two researchers are attempting to create a new psychotherapy protocol that more reduces panic attacks. they believe that they have succeeded and are now in the clinical trial period of their protocol's development. they are working with several cohort groups, some of which have been through the new protocol, while others have done the standard protocol currently recommended. if these researchers are interested in evaluating the difference in the percentage of test subjects who successfully decreased their panic attacks in 2 months on the new protocol versus the percentage of test subjects who successfully decreased their panic attacks in 2 months with the traditional protocol, which of the following statistical tests would be most appropriate? a. analysis of variance (anova) b. correlation c. chi-square test d. paired t-test e. independent t-test
Answers: 2
You know the right answer?
Questions
Mathematics, 27.04.2021 01:00
Mathematics, 27.04.2021 01:00

English, 27.04.2021 01:00

English, 27.04.2021 01:00

Mathematics, 27.04.2021 01:00
Mathematics, 27.04.2021 01:00
Mathematics, 27.04.2021 01:00
Mathematics, 27.04.2021 01:00
Mathematics, 27.04.2021 01:00
Engineering, 27.04.2021 01:00

Social Studies, 27.04.2021 01:00


