
Mathematics, 06.05.2020 05:58 maddie7155
A biologist created the following graph to show the relationship between the temperature of water (x), in degrees Celsius, and the number of insect larvae (y) in the water:
What does the peak of the graph represent?
The number of larvae in the water is greatest at 450 degrees Celsius.
The number of larvae in the water is greatest at 5 degrees Celsius.
The least number of larvae in the water is 450.
The least number of larvae in the water is 5.
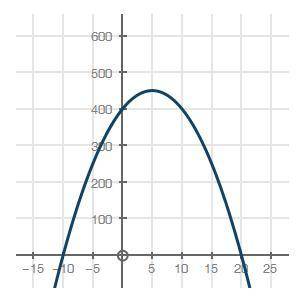

Answers: 3


Another question on Mathematics
Mathematics, 21.06.2019 18:30
Maria walks a round trip of 0.75 mile to school every day.how many miles will she walk in 4.5 days
Answers: 2
Mathematics, 21.06.2019 20:10
Ascientist has discovered an organism that produces five offspring exactly one hour after its own birth, and then goes on to live for one week without producing any additional offspring. each replicated organism also replicates at the same rate. at hour one, there is one organism. at hour two, there are five more organisms. how many total organisms are there at hour seven? 2,801 19,531 19,607 97.655
Answers: 1
You know the right answer?
A biologist created the following graph to show the relationship between the temperature of water (x...
Questions

Biology, 29.01.2020 23:03
Biology, 29.01.2020 23:03


World Languages, 29.01.2020 23:03

Computers and Technology, 29.01.2020 23:03
History, 29.01.2020 23:03


History, 29.01.2020 23:03
Mathematics, 29.01.2020 23:03


