
Mathematics, 06.05.2020 06:11 AlexS11
The dot plots show the amounts of time that ten South African students and ten Australian students took to get to school. Without calculating, answer the questions.
a. Which data set has the smaller mean? Explain your reasoning.
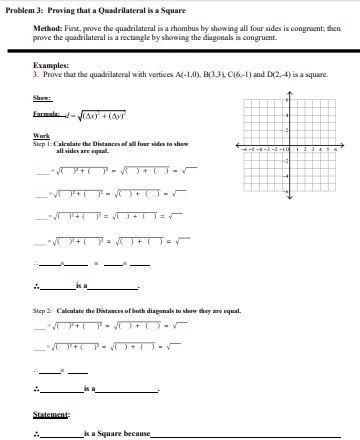
b. Which data set has the smaller MAD? Explain your reasoning.
c. What does a smaller mean tell us in this context?
d. What does a smaller MAD tell us in this context?

Answers: 1


Another question on Mathematics
Mathematics, 21.06.2019 18:30
Need an artist designed a badge for a school club. figure abcd on the coordinate grid below shows the shape of the badge: the badge is enlarged and plotted on the coordinate grid as figure jklm with point j located at (2, -2) and point m is located at (5, 4). which of these could be the coordinates for point l? a. (2, 4) b. (8, 4) c. (5, 1) d. (5, 7)
Answers: 2
Mathematics, 21.06.2019 20:00
Which of the following is an equation of a line parallel to the equation y=4x+1?
Answers: 1
Mathematics, 21.06.2019 20:00
1: 4 if the wew 35 surfboards at the beach how many were short boards?
Answers: 1
Mathematics, 21.06.2019 22:30
Find the area of the region that is inside r=3cos(theta) and outside r=2-cos(theta). sketch the curves.
Answers: 3
You know the right answer?
The dot plots show the amounts of time that ten South African students and ten Australian students t...
Questions

English, 21.10.2021 14:00

English, 21.10.2021 14:00

Social Studies, 21.10.2021 14:00
English, 21.10.2021 14:00

Health, 21.10.2021 14:00
English, 21.10.2021 14:00
Mathematics, 21.10.2021 14:00
Mathematics, 21.10.2021 14:00
History, 21.10.2021 14:00
Mathematics, 21.10.2021 14:00

Mathematics, 21.10.2021 14:00
Mathematics, 21.10.2021 14:00


