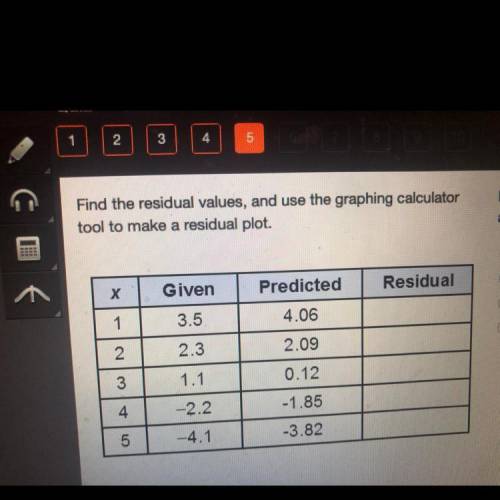
Find the residual values, and use the graphing calculator tool to make a residual plot.
(sorry...

Mathematics, 06.05.2020 04:19 xmanavongrove55
Find the residual values, and use the graphing calculator tool to make a residual plot.
(sorry the picture is bad)
does the residual plot show that the line of best fit is appropriate for the data?
a.) yes, because the points have no clear pattern.
b.) no, the points have no pattern.
c.) no, the points are in a linear pattern.
d.) yes, the points are in a curved pattern.
please try to hurry!!

Answers: 1


Another question on Mathematics
Mathematics, 21.06.2019 17:30
If jaime wants to find 60% of 320, which table should he use?
Answers: 1
Mathematics, 21.06.2019 19:10
Girardo is using the model below to solve the equation . girardo uses the following steps: step 1 add 4 negative x-tiles to both sides step 2 add 1 negative unit tile to both sides step 3 the solution is which step could be adjusted so that gerardo's final step results in a positive x-value? in step 1, he should have added 4 positive x-tiles to both sides. in step 1, he should have added 3 negative x-tiles to both sides. in step 2, he should have added 4 negative unit tiles to both sides. in step 2, he should have added 1 positive unit tile to both sides.
Answers: 2
Mathematics, 21.06.2019 22:20
Let f(x) = 5/x and g(x)=2x2+5x. what two numbers are not in the domain of f o g
Answers: 2
You know the right answer?
Questions
Mathematics, 09.04.2020 21:25
Mathematics, 09.04.2020 21:25

Mathematics, 09.04.2020 21:25

Medicine, 09.04.2020 21:25
Chemistry, 09.04.2020 21:25

English, 09.04.2020 21:25

Business, 09.04.2020 21:25
Mathematics, 09.04.2020 21:25

Biology, 09.04.2020 21:25


History, 09.04.2020 21:25
Mathematics, 09.04.2020 21:25


