
Mathematics, 05.05.2020 23:08 theo39
Workers at a certain soda drink factory collected data on the volumes (in ounces) of a simple random sample of 17 cans of the soda drink. Those volumes have a mean of 12.19 oz and a standard deviation of 0.11 oz, and they appear to be from a normally distributed population. If the workers want the filling process to work so that almost all cans have volumes between 11.94 oz and 12.50 oz, the range rule of thumb can be used to estimate that the standard deviation should be less than 0.14 oz. Use the sample data to test the claim that the population of volumes has a standard deviation of less than 0.14 oz. Use a 0.01 significance level.
a. Identify the null and alternative hypotheses.
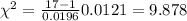
b. Compute the test statistic. (Round to three decimal places as needed.)
c. Find the p-value. (Round to four decimal places as needed.)
d. State the conclusion.

Answers: 2


 represent the sample size
 represent the confidence level
 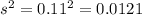 represent the sample variance obtained
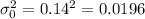 represent the value that we want to test


Another question on Mathematics
Mathematics, 21.06.2019 16:00
Consider the reaction 2x2y2+z2⇌2x2y2z which has a rate law of rate= k[x2y2][z2] select a possible mechanism for the reaction.
Answers: 2
Mathematics, 21.06.2019 23:30
Consider the sequence below. 3 , 1 , 1/3 , 1/9 , select the explicit function which defines the sequence.
Answers: 1
Mathematics, 22.06.2019 01:30
The population of a bacteria colony grows by a consistent percentage each hour and can be modeled by the function y = 500(1.16)t. what does the value 500 represent in the function?
Answers: 2
Mathematics, 22.06.2019 03:00
Find four solutions of the given function. write the solutions as ordered pairs. 4x – y = 4
Answers: 1
You know the right answer?
Workers at a certain soda drink factory collected data on the volumes (in ounces) of a simple random...
Questions
Mathematics, 20.02.2020 21:00


