2. a) Find the break - even points for company X, which sells all it produces, if the
variable...

Mathematics, 05.05.2020 21:04 tonta22
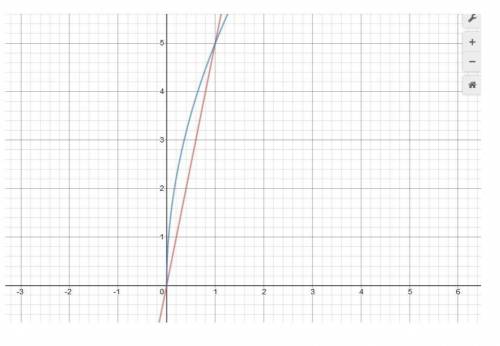
2. a) Find the break - even points for company X, which sells all it produces, if the
variable cost per unit is $3, fixed costs are $2 and Yrr = 5/9, where q is the number
of thousands of units of output produced.
b) Graph the total revenue curve and the total cost curve in the same plane.
c) Use your answer in (a) to report the quantity interval in which maximum profit
occurs.
Show all steps to get full credit. Solve it Algebraically

Answers: 2


Another question on Mathematics
Mathematics, 21.06.2019 20:30
Drag the tiles to the correct boxes to complete the pairs. not all tiles will be used. match each division expression with the correct quotient.
Answers: 2
Mathematics, 21.06.2019 23:00
The coordinate grid shows a pentagon. the pentagon is translated 3 units to the right and 5 units up to create a new pentagon. what is the rule for the location of the new pentagon?
Answers: 3
Mathematics, 21.06.2019 23:20
Point r divides in the ratio 1 : 5. if the coordinates of e and f are (4, 8) and (11, 4), respectively, what are the coordinates of r to two decimal places?
Answers: 2
Mathematics, 21.06.2019 23:40
Mikes car gets an average of 28 mpg. there are 12 gallons of fuel in mikes car when he starts his trip of 140 miles. about how many gallons are left at the end of his trip?
Answers: 1
You know the right answer?
Questions


Physics, 15.04.2021 17:20
Mathematics, 15.04.2021 17:20


Computers and Technology, 15.04.2021 17:20
Mathematics, 15.04.2021 17:20

Business, 15.04.2021 17:20

Arts, 15.04.2021 17:20
Mathematics, 15.04.2021 17:20

Chemistry, 15.04.2021 17:20
History, 15.04.2021 17:20
Mathematics, 15.04.2021 17:20
Mathematics, 15.04.2021 17:20
Mathematics, 15.04.2021 17:20


