 ) approaches the whole population mean (
 ).
).


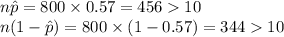
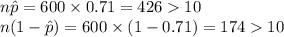
 = 0.61 check the conditions as follows:
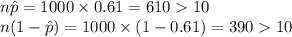
 .
.


To estimate the percentage of a state's voters who support the current
governor for reel...

Mathematics, 05.05.2020 19:12 hannah1571
To estimate the percentage of a state's voters who support the current
governor for reelection, three newspapers each survey a simple random
sample of voters. Each paper calculates the percentage of voters in their
sample who support the governor and uses that as an estimate for the
population parameter. Here are the results:
• The Herald: n = 1000 voters sampled; sample estimate = 61%
• The Tribune: n = 800 voters sampled; sample estimate = 57%
The Times: n= 600 voters sampled; sample estimate = 71%
All else being equal, which newspaper's estimate is likely closest to the actual
percentage of voters who support the governor for reelection?
CITI

Answers: 1


Another question on Mathematics
Mathematics, 21.06.2019 19:30
Піf x = y and y= z, which statement must be true? оа. -x = -2 b. x= z ос. —x = 2 od. 2= x
Answers: 3
Mathematics, 21.06.2019 23:00
Each of the following data sets has a mean of x = 10. (i) 8 9 10 11 12 (ii) 7 9 10 11 13 (iii) 7 8 10 12 13 (a) without doing any computations, order the data sets according to increasing value of standard deviations. (i), (iii), (ii) (ii), (i), (iii) (iii), (i), (ii) (iii), (ii), (i) (i), (ii), (iii) (ii), (iii), (i) (b) why do you expect the difference in standard deviations between data sets (i) and (ii) to be greater than the difference in standard deviations between data sets (ii) and (iii)? hint: consider how much the data in the respective sets differ from the mean. the data change between data sets (i) and (ii) increased the squared difference îł(x - x)2 by more than data sets (ii) and (iii). the data change between data sets (ii) and (iii) increased the squared difference îł(x - x)2 by more than data sets (i) and (ii). the data change between data sets (i) and (ii) decreased the squared difference îł(x - x)2 by more than data sets (ii) and (iii). none of the above
Answers: 2
Mathematics, 21.06.2019 23:30
Find each value of the five-number summary for this set of data. [note: type your answers as numbers. do not round.] 46, 19, 38, 27, 12, 38, 51 minimum maximum median upper quartile lower quartile
Answers: 1
Mathematics, 22.06.2019 01:20
Graph the following system of linear inequalities. identify at least two points in the solution: y < 5 - 2x | x + 5y > -7
Answers: 2
You know the right answer?
Questions

Physics, 12.12.2020 15:50

Mathematics, 12.12.2020 15:50
Mathematics, 12.12.2020 15:50

Mathematics, 12.12.2020 15:50
Mathematics, 12.12.2020 15:50

Social Studies, 12.12.2020 15:50
Mathematics, 12.12.2020 15:50


Spanish, 12.12.2020 15:50


