
Mathematics, 05.05.2020 16:15 avahrider1
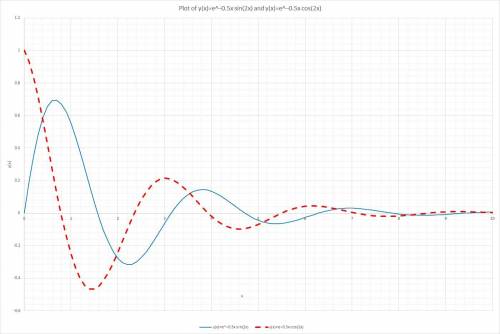
Plot the function y(x)=e–0.5x sin(2x) for 100 values of x between 0 and 10. Use a 2- point-wide solid blue line for this function. Then plot the function y(x)=e–0.5x cos(2x) on the same axes. Use a 3-point-wide dashed red line for this function. Be sure to include a legend, title, axis labels, and grid on the plots

Answers: 2


Another question on Mathematics
Mathematics, 21.06.2019 19:30
Acar started driving from city a to city b, distance between which is 620 miles, at a rate of 60 mph. two hours later a truck left city b and started moving towards city a at a rate of 40 mph. how many hours after the truck's departure will the two meet?
Answers: 1
Mathematics, 22.06.2019 04:30
There are a total of 75 students in the robotics club and the science club. the science club has 11 more students than the robotics club. how many students are in the science club?
Answers: 2
You know the right answer?
Plot the function y(x)=e–0.5x sin(2x) for 100 values of x between 0 and 10. Use a 2- point-wide soli...
Questions

English, 12.07.2019 03:00

Biology, 12.07.2019 03:00

History, 12.07.2019 03:00
Mathematics, 12.07.2019 03:00
Biology, 12.07.2019 03:00
Biology, 12.07.2019 03:00
Mathematics, 12.07.2019 03:00
Mathematics, 12.07.2019 03:00
Mathematics, 12.07.2019 03:00
Mathematics, 12.07.2019 03:00

Health, 12.07.2019 03:00
History, 12.07.2019 03:00

Computers and Technology, 12.07.2019 03:00
Biology, 12.07.2019 03:00


