
Mathematics, 05.05.2020 13:58 tammydbrooks43
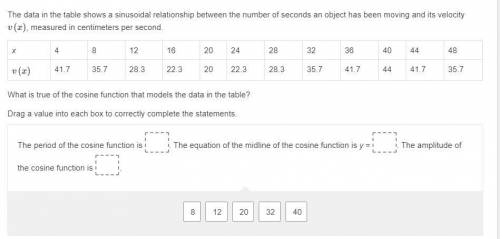
The data in the table shows a sinusoidal relationship between the number of seconds an object has been moving and its velocity v(x), measured in centimeters per second. What is true of the cosine function that models the data in the table?
Drag a value into each box to correctly complete the statements. PLEASE HELP!

Answers: 1


Another question on Mathematics
Mathematics, 21.06.2019 14:30
Apple pie is removed from 350 degree oven. temperature of the pie t minutes after being removed id given by the function t(t)=72+268e-0.068t
Answers: 1
Mathematics, 22.06.2019 01:50
If its non of them tell me..valerie took a day-trip. she drove from her house for a while and took a coffee break. after her coffee break, she continued driving. after 2 hours of driving after her coffee break, her distance from her house was 210 miles. her average speed during the whole trip was 60 miles per hour.valerie created the equation y−210=60(x−2) to represent this situation, where xx represents the time in hours from her coffee break and yy represents the distance in miles from her house.which graph correctly represents valerie's distance from her house after her coffee break?
Answers: 1
Mathematics, 22.06.2019 03:00
Analyze the diagram below and complete the instructions that follow. 600413 300 find the value of x and the value of y. a. x-2-2,-8 b. 1-2, y - 4/6 c. x-2-/2, 7-2-6 d. x-2/3, 7-63
Answers: 1
You know the right answer?
The data in the table shows a sinusoidal relationship between the number of seconds an object has be...
Questions
Mathematics, 23.01.2021 01:00
Mathematics, 23.01.2021 01:00

Mathematics, 23.01.2021 01:00

Mathematics, 23.01.2021 01:00
Mathematics, 23.01.2021 01:00
Mathematics, 23.01.2021 01:00
Mathematics, 23.01.2021 01:00


Advanced Placement (AP), 23.01.2021 01:00
History, 23.01.2021 01:00
Mathematics, 23.01.2021 01:00


English, 23.01.2021 01:00
English, 23.01.2021 01:00


