Clusions The table shows the high temperatures
11. MP Justify Conclusions The table shows the<...

Mathematics, 05.05.2020 12:11 cassandramanuel
Clusions The table shows the high temperatures
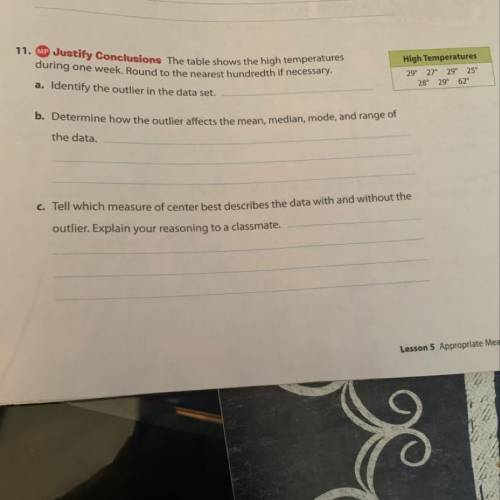
11. MP Justify Conclusions The table shows the
during one week. Round to the nearest hundredth it
a. Identify the outlier in the data set.
High Temperatures
29° 27° 29' 25°
28° 29° 62°
b. Determine how the outlier affects the mean
now the outlier affects the mean, median, mode, and range of
the data.
C. Tell which measure of center best describes the data with and without the
outlier. Explain your reasoning to a classmate.
Helppp 36 points

Answers: 2


Another question on Mathematics
Mathematics, 20.06.2019 18:04
Apine tree that is 140 feet tall is added to the sample. how will this outlier affect the shape of the box plot?
Answers: 1
Mathematics, 21.06.2019 19:30
Two variables, x and y, vary inversely, and x=12 when y=4. what is the value of y when x=3?
Answers: 1
Mathematics, 21.06.2019 23:50
The height of a plant, in inches, p years after planting it is given by the polynomial function r(p) = -2p% + 270p. find the height of the plant when p = 90 years.
Answers: 3
You know the right answer?
Questions

Arts, 29.01.2021 23:50
Mathematics, 29.01.2021 23:50
Mathematics, 29.01.2021 23:50
Mathematics, 29.01.2021 23:50

Advanced Placement (AP), 29.01.2021 23:50

Mathematics, 29.01.2021 23:50
Mathematics, 29.01.2021 23:50
Mathematics, 29.01.2021 23:50

Chemistry, 29.01.2021 23:50


