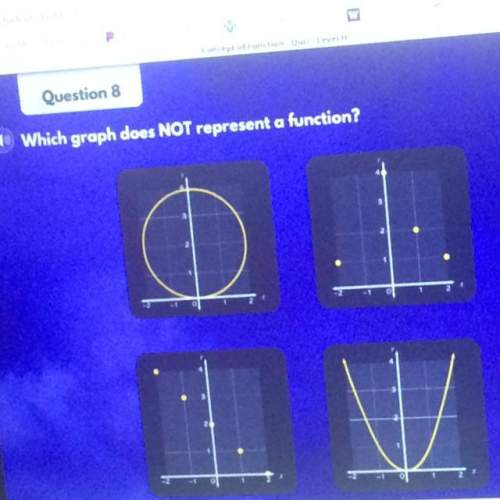
The boxplot below represents the number of texts sent in two minutes by 11
different freshmen....

Mathematics, 05.05.2020 10:11 mt137896
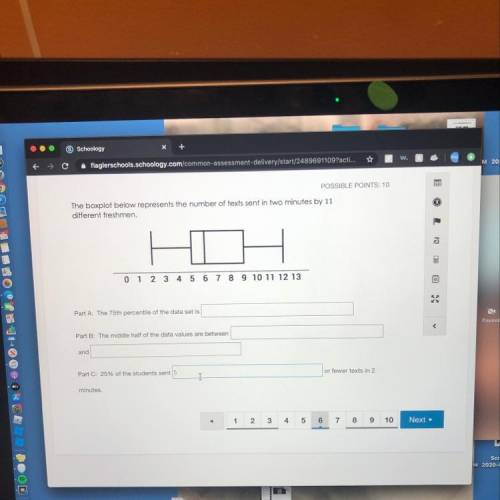
The boxplot below represents the number of texts sent in two minutes by 11
different freshmen.
0
1
2 3 4 5 6
7 8
9 10 11 12 13
Part A: The 75th percentile of the data set is
Part B: The middle half of the data values are between
and
Part C: 25% of the students sent
or fewer texts in 2
minutes.

Answers: 2


Another question on Mathematics
Mathematics, 21.06.2019 18:30
Kayla wants to find the width, ab, of a river. she walks along the edge of the river 65 ft and marks point c. then she walks 25 ft further and marks point d. she turns 90° and walks until her location, point a, and point c are collinear. she marks point e at this location, as shown. (a) can kayla conclude that δ and δ are similar? why or why not? (b) suppose de = 15 ft. what can kayla conclude about the width of the river?
Answers: 2
Mathematics, 21.06.2019 21:50
Which equation shows the quadratic formula used correctly to solve 5x2 + 3x -4 0 for x? cos -3+ v (3) 2-4() 2(5) 3+ |(3)² +4() 205) 3+ (3) 2-4() -3+ v (3)² +4()
Answers: 1
Mathematics, 22.06.2019 00:00
Subtract and simplify. (-y^2 – 4y - 8) – (-4y^2 – 6y + 3) show how you got the answer if your answer is right i will mark you
Answers: 1
Mathematics, 22.06.2019 00:00
240 seventh graders and two-thirds of the students participate in after-school activities how many students participate in after-school activities
Answers: 1
You know the right answer?
Questions


Chemistry, 25.03.2021 01:00


World Languages, 25.03.2021 01:00


English, 25.03.2021 01:00
Mathematics, 25.03.2021 01:00
Mathematics, 25.03.2021 01:00
English, 25.03.2021 01:00


