
Mathematics, 05.05.2020 07:18 8336622
Car: A graph has years on the x-axis and value (dollars) on the y-axis. A line goes through (2, 16,500) and (6, 10,900). Truck: A 2-column table with 3 rows. Column 1 is labeled Years: x with entries 0, 3, 6. Column 2 is labeled Value (dollars): y with entries 21,000, 17,700, and 14,400.
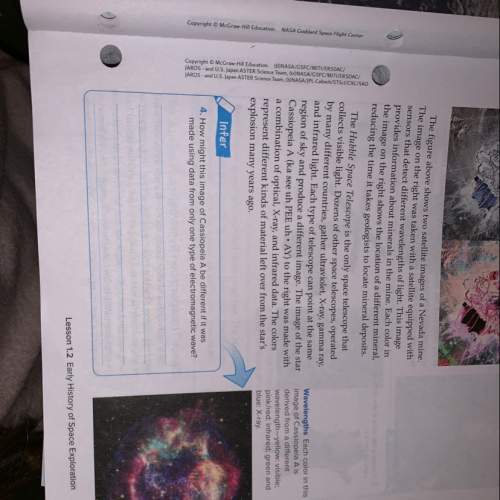
Use the graph and table to answer the questions.
Which vehicle loses the most value each year?
Which vehicle will lose all of its value first?
If the truck’s rate of depreciation changes to a decrease of $1,650 each year, which vehicle will lose all of its value first?

Answers: 1


Another question on Mathematics
Mathematics, 22.06.2019 00:30
What is the mean of the data set 125, 141, 213, 155, 281
Answers: 2
Mathematics, 22.06.2019 03:00
An object is accelerating at a constant rate. its velocity in feet per second as a function of time in seconds can be modeled by the linear function v(t) = 2.5t. what does the dependent variable represent for this function? a) acceleration b) distance c) slope d) velocity
Answers: 3
Mathematics, 22.06.2019 04:00
Find the x-intercepts for the parabola defined by this equation: y=-3x^2-6x+9
Answers: 1
Mathematics, 22.06.2019 04:30
Darcy bought 1/2 pound of cheese and 3/4 pound of hamburger for a barbecue.use the numbers to compare the amounts of cheese and hamburger darcy bought.
Answers: 1
You know the right answer?
Car: A graph has years on the x-axis and value (dollars) on the y-axis. A line goes through (2, 16,5...
Questions


Physics, 07.04.2020 21:34


Chemistry, 07.04.2020 21:34

Spanish, 07.04.2020 21:34

Biology, 07.04.2020 21:35


