
Mathematics, 05.05.2020 07:27 20lm1207
If you dont know some questions then send me the other ones first. The picture is for the last question.
1. Scott discovers a leak in his kitchen sink. He puts a bowl under the leak to collect the water. The graph shows the relationship between the number of hours water was leaking and the amount of water, in cups, collected in the bowl. Write an equation that can be used to find c, the number of cups of water collected from the leaking sink after h hours.
2. Scott discovers a leak in his kitchen sink. He puts a bowl under the leak to collect the water. The graph shows the relationship between the number of hours water was leaking and the amount of water, in cups, collected in the bowl. The bowl that Scott put in the sink to collect the water can hold 32 cups. After how many hours will the bowl be full of water from the leak? Show your thinking and include units in your answer
3. A small pool is leaking water from a hole. After 2 ½ minutes, 3 ⅓ liters of water have leaked out. At this rate, how many liters of water will have leaked out after 10 minutes? Show your thinking. Include units in your answer.
4. The equation F = 9/5C + 32 relates temperature measured in degrees Celsius, C, to degrees Fahrenheit, F. Determine whether there is a proportional relationship between C and F. Explain or show your reasoning using a table or a graph. *
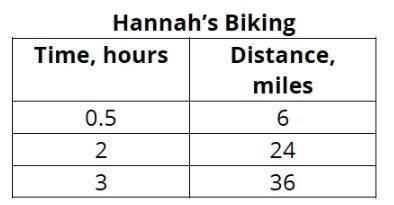
5. Hannah and Nora are biking at constant speeds. Hannah’s distance and time are shown in the table below. Nora’s distance and time are represented by the equation = 11, where is measured in miles and is measured in hours. Who is biking at a faster speed? Explain how you know. *

Answers: 3


Another question on Mathematics
Mathematics, 21.06.2019 18:00
Suppose you are going to graph the data in the table. minutes temperature (°c) 0 -2 1 1 2 3 3 4 4 5 5 -4 6 2 7 -3 what data should be represented on each axis, and what should the axis increments be? x-axis: minutes in increments of 1; y-axis: temperature in increments of 5 x-axis: temperature in increments of 5; y-axis: minutes in increments of 1 x-axis: minutes in increments of 1; y-axis: temperature in increments of 1 x-axis: temperature in increments of 1; y-axis: minutes in increments of 5
Answers: 2
Mathematics, 21.06.2019 18:30
Write the slope-intercept form of the line that passes through the point (1, 0) and is parallel to x - y = 7. t
Answers: 2
You know the right answer?
If you dont know some questions then send me the other ones first. The picture is for the last quest...
Questions
Mathematics, 24.09.2019 07:50

Computers and Technology, 24.09.2019 07:50
Mathematics, 24.09.2019 07:50

Social Studies, 24.09.2019 07:50


History, 24.09.2019 07:50
History, 24.09.2019 07:50
History, 24.09.2019 07:50
History, 24.09.2019 07:50
Biology, 24.09.2019 07:50
History, 24.09.2019 07:50

Social Studies, 24.09.2019 07:50
Biology, 24.09.2019 07:50


