Using the dot plot, determine the best measures for the data.
In game one of a basketball tourn...

Mathematics, 05.05.2020 05:59 bionicboy03120440
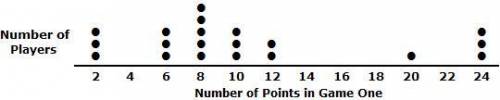
Using the dot plot, determine the best measures for the data.
In game one of a basketball tournament, the number of points each participating player scored was recorded and used in the dot plot below.
The best measure of center is the , _and the best measure of variability is the _.
The number that best summarizes the data is _ points scored.
The number that best describes how the data varies is _ points scored.

Answers: 3


Another question on Mathematics
Mathematics, 21.06.2019 18:00
10 ! a train starts from grand city and travels toward belleville 388 miles away. at the same time, a train starts from belleville and runs at the rate of 47 miles per hour toward grand city. they pass each other 4 hours later. find the rate of the train from grand city.
Answers: 1
Mathematics, 21.06.2019 19:00
Eis the midpoint of line segment ac and bd also line segment ed is congruent to ec prove that line segment ae is congruent to line segment be
Answers: 3
Mathematics, 21.06.2019 21:00
To finance her community college education, sarah takes out a loan for $2900. after a year sarah decides to pay off the interest, which is 4% of $2900. how much will she pay
Answers: 1
Mathematics, 21.06.2019 22:00
Find two consexutive odd integers such that the sum of their square is 650
Answers: 2
You know the right answer?
Questions

Chemistry, 11.10.2019 16:00


History, 11.10.2019 16:00

English, 11.10.2019 16:00
English, 11.10.2019 16:00
Mathematics, 11.10.2019 16:00
History, 11.10.2019 16:00

Biology, 11.10.2019 16:00
Mathematics, 11.10.2019 16:10
Mathematics, 11.10.2019 16:10

English, 11.10.2019 16:10


